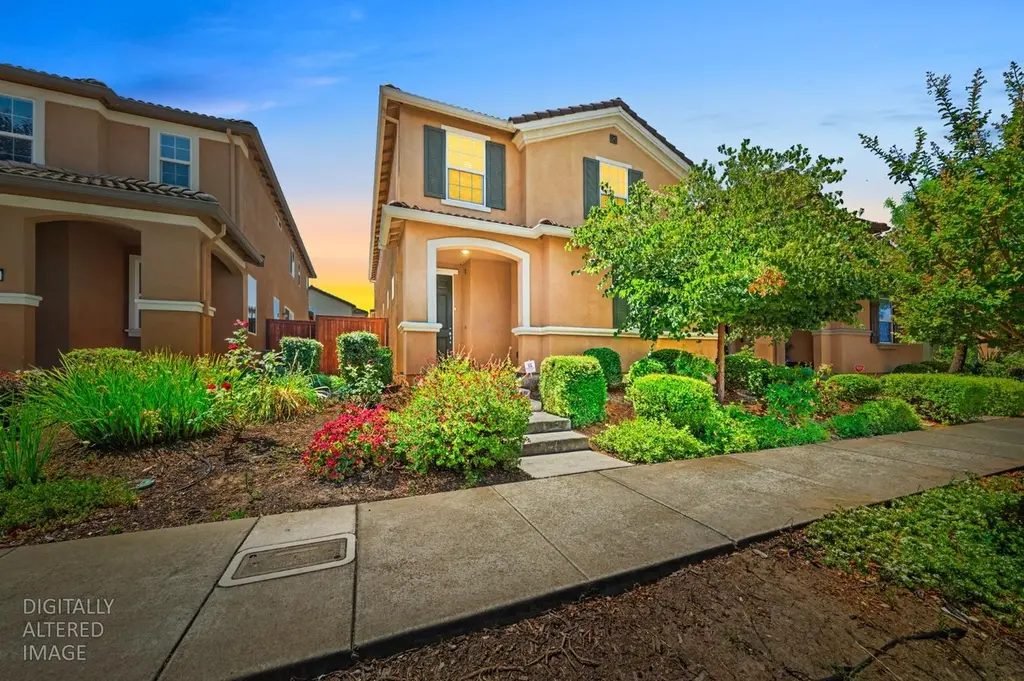
3082 Club Center Dr
Sacramento, CA 95835
$529,888D
4 bd · 2.5 ba ·
2,204 sqft ·
Built 2017
· SingleFamily
· Active
· 1 DOM
Cashflow @ list (25.0% down · 7.5%)
Estimated rent
$3,274/mo
Mortgage (P&I)
−$2,779
Tax + insurance
−$895
HOA
−$73
Vac / Maint / Mgmt
−$688
Net cashflow
$-1,160/mo
Annual
$-13,925/yr
Cap rate
3.95%
Cash-on-cash
-8.37%
DSCR
0.63
1% rule
0.62%
Cash to close
$148,369
Investor read
- This is a 4-bed/2.5-bath single-family listed at $530k.
- At list price, monthly cash flow is $-1k ($-14k/yr) — negative.
- To cash-flow at today's rent, offer at most $325k (38.7% below list).
- To meet the 1% rule (rent ≥ 1% of price), the offer needs to be $327k (38.2% below list).
- Only 1 days on market — expect competitive offers; lowballing is unlikely to land.
- Recommended offer: $325k (38.7% below list) — sets the bar for cash-flow.
- In year one you build about $52k of equity ($4k loan paydown + $49k appreciation (9.2% local appreciation)).
- Location reads 71/100 on livability (#218 in CA) — a middle-class / working-renter tenant base. Strengths: amenities A+, commute A+, housing A; Watch: schools D+, crime F, cost of living F.
- Natomas Unified (urban): math 33% / reading 60% proficiency, ranked #155 of 517 in CA (top 30%) — families likely to look elsewhere, expect single-tenant / working-renter base with shorter leases.
- Watch-outs: flood insurance adds $125/mo.
- Market conditions: Rents rising (+1.4%/yr); 402 active listings in the ZIP; 31 comparable units currently listed for rent nearby; rentals leasing fast (median 8d on market — plan ~1-2 weeks tenant-placement turnaround); high-income renter base; 6,825 units permitted in Sacramento County in 2024 (1,752 in 5+ unit buildings).
- Sacramento County population projected at +17% by 2050 — long-run rental-demand tailwind backs the buy-and-hold thesis.
- By year 2, paydown + projected appreciation supports a ~$84k cash-out refi (75% LTV) — recoverable capital for the next deal without selling this one.
- Climate carrying-cost: in FEMA flood zone A99 (mandatory federal flood insurance); moderate wildfire risk; extreme-heat days projected 7→15/yr by 2055 (HVAC capex compounding) — expect insurance premiums to compound above CPI over the hold.
- Cap rate 3.9% vs local median 3.0% in Sacramento — top-decile yield for the area; either an underpriced asset or a hidden risk that comps aren't pricing in. Stress-test before assuming the spread holds.
- This rent runs 34% of the median local income ($114k/yr) — at the standard rent-burdened threshold; future hikes will face affordability resistance.
Questions for listing agent
- What do current leases actually rent for vs. the listed asking? Can we see a recent rent roll and the last 12 months of T-12 income?
- What's the actual annual flood-insurance premium (NFIP or private), and is the property in a SFHA with mandatory coverage?
- What does the HOA fee cover, when was the last increase, and are there any pending special assessments or reserve-fund shortfalls?
- Is there a deadline driving the sale (1031 exchange, divorce, estate, relocation)? That informs how much negotiation room exists.
- Schools are D-rated, which usually means shorter tenancies and higher turnover. Who's the typical renter profile here, and what's been the actual vacancy rate?
- Crime grade is F in this area — have there been break-ins, vandalism, or insurance claims at this property in the last 3 years? What carrier currently insures it and at what premium?
- The area grade is low — what's the realistic commute time and amenity access for the typical tenant pool here? Any planned neighborhood developments (good or bad) we should know about?
- What's the average days-on-market for RENTAL listings here right now (not sales)? A rising rental-DOM trend means longer vacancies and softer asking-rent achievability than the comps imply.
CashFlowRE · CFR-HGY0D995BQQ8V2
· Data 2 days ago
cashflowre.app · 2026-05-29