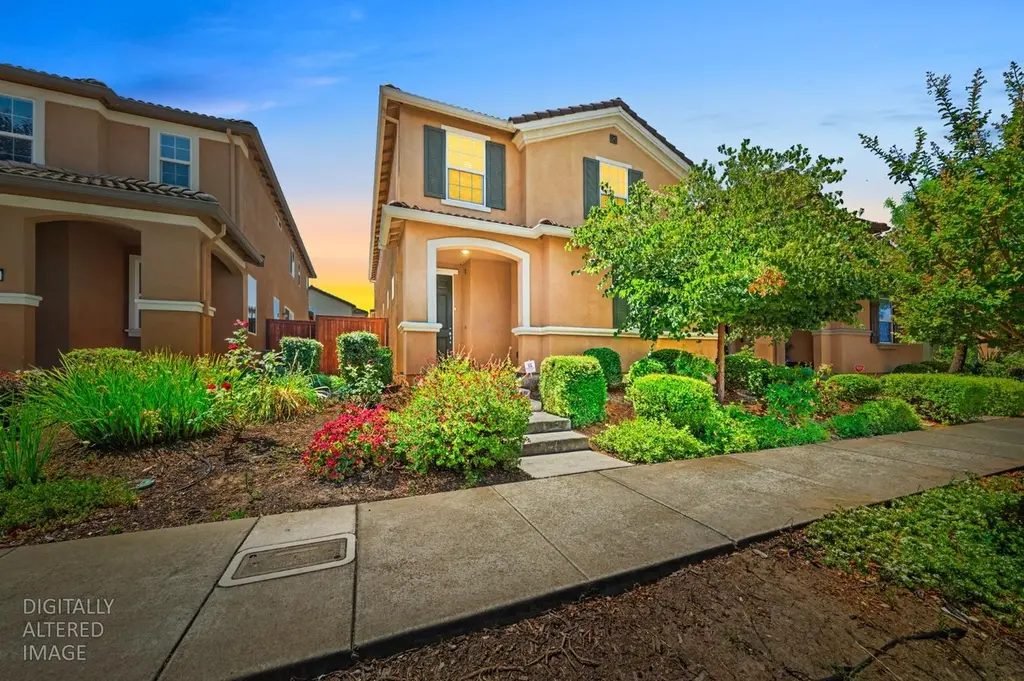
3082 Club Center Dr · Sacramento, CA
Flood risk 1/10 · Minimal
- FEMA flood zone
- A99
- Chance of flooding over 30 yrs
- 0.0%
- Est. flood insurance / yr
- $1,009 – $1,996
Fire risk 5/10 · Moderate
- Est. fire insurance / yr
- $659 – $1,223
Heat risk 7/10 · Major
- Hot days now (above 103°F)
- 7 days/yr
- Hot days in 30 yrs
- 15 days/yr
Wind risk 1/10 · Minimal
- Chance of severe wind over 30 yrs
- —
Air-quality risk 10/10 · Severe
- Unhealthy air days now
- 29 days/yr
- Unhealthy air days in 30 yrs
- 33 days/yr
Risk factors via First Street. Map © Google.
Why this score? — see what drove the D grade
The composite is a weighted blend of 9 inputs, each scored 0–100. Each bar is that input's sub-score; the figure is the points it added to the 100-point composite (weight × sub-score).
- ARV discount +13.9/15.0
- Appreciation +9.6/10.0
- Cash flow +5.9/30.0
- Schools +4.1/10.0
- Livability +3.6/5.0
- Rent growth +2.9/5.0
- Condition / age +2.5/5.0
- 1% rule +1.2/10.0
- DSCR +0.3/10.0
$529,888
🖨 Deal sheet 📄 Offer letter ✓ Due diligence
Listing remarks
Welcome to this spacious North Natomas home offering 5 bedrooms, 3 full bathrooms, and approximately 2,204 square feet of thoughtfully designed living space. Built in 2017, this two-story residence features a flexible floor plan with a desirable downstairs bedroom and full bath, ideal for guests, multigenerational living, or a home office. The open-concept kitchen flows seamlessly into the dining and living areas, creating a comfortable space for everyday living and entertaining. Upstairs, you'll find generously sized bedrooms, including a private primary suite with ample closet space and an en-suite bath. Situated in a well-established Natomas neighborhood, this home offers low-maintenance
Key facts
- 2,705 sq ft lot
- 2 garage spots
- Built 2017
Property features AI
Finance
- HOA & community: Mandatory homeowners association; Monthly HOA fee of $73; HOA covers grounds maintenance; Community amenities: other
Exterior
- Parking: Attached garage facing the rear; 2-car garage
- Utilities: 220-volt electric service; Public water; Public sewer; Irrigation: other
- Home design: Detached single-family residence; Two-story home; Built in 2017
- Construction: Tile roof
- Exterior features: Low-maintenance, regularly shaped lot
Interior
- Kitchen: Free-standing gas range; Free-standing refrigerator; Dishwasher; Microwave; Pantry cabinet; Island; Kitchen-family room combo
- Bedrooms: 5 bedrooms total; Primary bedroom with walk-in closet
- Flooring: Carpet; Tile
- Bathrooms: 3 full bathrooms; Primary bathroom with shower stall; Other bathrooms with shower stalls, tub/shower combos and windows
- Heating & cooling: Central heating; Central air conditioning
- Interior features: Great room; Dining and living areas combined; Kitchen open to family room; Pantry cabinet; Kitchen island
- Laundry & utility: Laundry hookups inside on upper floor
Neighborhood map
What this means for you Summary
Snapshot
- This is a 4-bed/2.5-bath single-family listed at $530k.
Deal economics
- At list price, monthly cash flow is $-1k ($-14k/yr) — negative.
- To cash-flow at today's rent, offer at most $325k (38.7% below list).
- To meet the 1% rule (rent ≥ 1% of price), the offer needs to be $327k (38.2% below list).
- Recommended offer: $325k (38.7% below list) — sets the bar for cash-flow.
- Cap rate 3.9% vs local median 3.0% in Sacramento — top-decile yield for the area; either an underpriced asset or a hidden risk that comps aren't pricing in. Stress-test before assuming the spread holds.
Location & tenants
- Location reads 71/100 on livability (#218 in CA) — a middle-class / working-renter tenant base. Strengths: amenities A+, commute A+, housing A; Watch: schools D+, crime F, cost of living F.
- Natomas Unified (urban): math 33% / reading 60% proficiency, ranked #155 of 517 in CA (top 30%) — families likely to look elsewhere, expect single-tenant / working-renter base with shorter leases.
- Market conditions: Rents rising (+1.4%/yr); 402 active listings in the ZIP; 31 comparable units currently listed for rent nearby; rentals leasing fast (median 8d on market — plan ~1-2 weeks tenant-placement turnaround); high-income renter base; 6,825 units permitted in Sacramento County in 2024 (1,752 in 5+ unit buildings).
- This rent runs 34% of the median local income ($114k/yr) — at the standard rent-burdened threshold; future hikes will face affordability resistance.
Forward outlook
- In year one you build about $52k of equity ($4k loan paydown + $49k appreciation (9.2% local appreciation)).
- Sacramento County population projected at +17% by 2050 — long-run rental-demand tailwind backs the buy-and-hold thesis.
- By year 2, paydown + projected appreciation supports a ~$84k cash-out refi (75% LTV) — recoverable capital for the next deal without selling this one.
Negotiation context
- Only 1 days on market — expect competitive offers; lowballing is unlikely to land.
Risks & watch-outs
- Watch-outs: flood insurance adds $125/mo.
- Climate carrying-cost: in FEMA flood zone A99 (mandatory federal flood insurance); moderate wildfire risk; extreme-heat days projected 7→15/yr by 2055 (HVAC capex compounding) — expect insurance premiums to compound above CPI over the hold.
Questions for the listing agent
- What do current leases actually rent for vs. the listed asking? Can we see a recent rent roll and the last 12 months of T-12 income?
- What's the actual annual flood-insurance premium (NFIP or private), and is the property in a SFHA with mandatory coverage?
- What does the HOA fee cover, when was the last increase, and are there any pending special assessments or reserve-fund shortfalls?
- Is there a deadline driving the sale (1031 exchange, divorce, estate, relocation)? That informs how much negotiation room exists.
- Schools are D-rated, which usually means shorter tenancies and higher turnover. Who's the typical renter profile here, and what's been the actual vacancy rate?
- Crime grade is F in this area — have there been break-ins, vandalism, or insurance claims at this property in the last 3 years? What carrier currently insures it and at what premium?
- The area grade is low — what's the realistic commute time and amenity access for the typical tenant pool here? Any planned neighborhood developments (good or bad) we should know about?
- What's the average days-on-market for RENTAL listings here right now (not sales)? A rising rental-DOM trend means longer vacancies and softer asking-rent achievability than the comps imply.
- What's the recent tenant-quality profile in this submarket — average credit score on applications, eviction rate, late-payment / NSF rate, and stable-employment percentage? A property-management company in the area should have these aggregated.
- How much new for-sale + rental construction is in the pipeline within 1–3 miles? Heavy new supply typically softens prices + rents 12–24 months out; constrained supply supports both.
Investment metrics
- 1% rule
- 0.62% ✗
- Cap rate
- 3.95%
- Cash-on-cash
- -8.37%
- DSCR
- 0.63
- GRM
- 13.5
CMA / ARV
- ARV (on-the-fly)
- $617,120
- Comps found
- 12
Show comp detail 12 sales within ~0.75 mi
| Address | Dist | Beds/Ba | Sqft | Sold | Price | $/sf | Match |
|---|---|---|---|---|---|---|---|
| 15 Bristle Bark Pl | 0.06mi | 4/3.0 | 2,238 (+2%) | 0mo | $560,000 | $250 | 92 |
| 5362 Seal Beach Way | 0.20mi | 4/2.5 | 2,137 (-3%) | 1mo | $598,000 | $280 | 85 |
| 2656 Maybrook Dr | 0.40mi | 4/3.0 | 2,265 (+3%) | 2mo | $640,000 | $283 | 74 |
| 141 Caravaggio Cir | 0.47mi | 3/2.5 (-1) | 2,200 (-0%) | 0mo | $530,000 | $241 | 73 |
| 9 Captains Gate Pl | 0.16mi | 3/2.5 (-1) | 1,962 (-11%) | 3mo | $514,990 | $262 | 67 |
| 4972 Madamin Way | 0.52mi | 3/2.5 (-1) | 2,131 (-3%) | 1mo | $510,000 | $239 | 64 |
| 2857 Maybrook Dr | 0.43mi | 3/2.5 (-1) | 2,363 (+7%) | 1mo | $645,600 | $273 | 62 |
| 46 Bascom Ct | 0.48mi | 4/2.5 | 2,007 (-9%) | 1mo | $599,900 | $299 | 61 |
| 2512 Mabry Dr | 0.60mi | 3/2.5 (-1) | 2,363 (+7%) | 0mo | $675,000 | $286 | 54 |
| 6 Sea Hawk Pl | 0.45mi | 3/2.5 (-1) | 1,962 (-11%) | 3mo | $545,000 | $278 | 54 |
| 2916 N Platte Way | 0.37mi | 3/2.0 (-1) | 1,877 (-15%) | 1mo | $549,000 | $292 | 50 |
| 3428 Shaker Way | 0.71mi | 3/2.5 (-1) | 1,917 (-13%) | 1mo | $590,905 | $308 | 40 |
Match score weights: distance 35% · size 25% · config 20% · recency 20%. Top-matched comps best support the ARV.
Projected returns pro-forma
9.18% appreciation · 1.43% rent growth · sell at horizon
- IRR
- 15.4%
- Equity multiple
- 2.22×
- Total profit
- $180,370
- Equity at exit
- $446,174
- IRR
- 14.7%
- Equity multiple
- 4.86×
- Total profit
- $573,428
- Equity at exit
- $930,826
Cash invested: $148,369 (down + closing). Projections, not guarantees.
Landlord ↔ Tenant lean methodology
- Overall (STATE)
- 18 Strongly Tenant-Friendly
- State California
- 18 Strongly Tenant-Friendly · D+13
- County
- — inherits STATE
- City
- — inherits STATE
ZIP-level market 95835
- Home prices YoY
- 3.5%
- Rents YoY
- 1.4%
- Active inventory
- 402
- Price-to-rent
- 13.5×
Monthly cashflow live
- Estimated rent
- $3,274 high interval (Pro) →
- Mortgage (P&I)
- −$2,779
- Tax from tax record
- −$549 /mo · $6,594/yr
- Insurance
- −$221
- Flood insurance flood zone
- −$125 /mo · $1,502/yr
- HOA
- −$73
- Vacancy / Maint / Mgmt
- −$688
- Net cashflow
- $-1,160
Break-even live
UW: 25.0% down · 7.5% · 30yr · 1.5% tax · 5.0% vac · 8.0% maint · 8.0% mgmt
Financing live
Cash to close
- Down payment
- $132,472
- Closing costs
- $15,897
- Reserves months
- —
- Total cash needed
- —
Loan-product check · same deal, 3 products live
Conventional
25% down · 7.5% · 30yr
- Down + closing
- —
- Monthly P&I
- —
- Monthly cashflow
- —
- DSCR
- —
- Eligible?
- —
Personal DTI + credit; lowest rate.
DSCR
20% down · 8.5% · 30yr
- Down + closing
- —
- Monthly P&I
- —
- Monthly cashflow
- —
- DSCR
- —
- Eligible?
- —
No personal income docs; deal must DSCR.
Hard money
10% down · 12.0% · 12mo
- Down + closing
- —
- Monthly P&I
- —
- Monthly cashflow
- —
- DSCR
- —
- Eligible?
- —
Short-term bridge; refi at stabilization.
Rent comps 31 comps
| Address | Beds | Baths | Sqft | Rent | $/sqft | DOM | Units | Dist |
|---|---|---|---|---|---|---|---|---|
| 5040 Kankakee Dr Sacramento, CA | 4.0 | 2.0 | 2454 | $2,895 | $1.18 | 3d | 1 | 0.31mi |
| 3301 N Park Dr Sacramento, CA | 3.0 | 2.5 | 1678 | $2,672 | $1.59 | 44d | 2 | 0.40mi |
| 11 Long Warf Pl Sacramento, CA | 3.0 | 2.5 | 1708 | $2,795 | $1.64 | 2d | 1 | 0.41mi |
| 100 Picasso Cir Sacramento, CA | 4.0 | 3.0 | 2413 | $3,950 | $1.64 | 3d | 1 | 0.42mi |
| 260 Wapello Cir Sacramento, CA | 3.0 | 3.0 | 1697 | $2,650 | $1.56 | 8d | 1 | 0.48mi |
| 30 Sheen Ct Sacramento, CA | 3.0 | 2.5 | 1652 | $2,850 | $1.73 | 44d | 1 | 0.57mi |
| 570 Wapello Cir Sacramento, CA | 3.0 | 2.5 | 1697 | $3,000 | $1.77 | 44d | 1 | 0.60mi |
| 789 Greg Thatch Cir Sacramento, CA | 3.0 | 2.5 | 2000 | $2,990 | $1.50 | 3d | 1 | 0.70mi |
| 5421 Shennecock Way Unit 1 Sacramento, CA | 4.0 | 2.5 | 2561 | $3,000 | $1.17 | 11d | 1 | 0.70mi |
| 5663 Lolet Way Sacramento, CA | 4.0 | 3.0 | 2630 | $3,295 | $1.25 | 2d | 1 | 0.72mi |
| 3396 Shaker Way Sacramento, CA | 3.0 | 2.5 | 1815 | $3,250 | $1.79 | 12d | 1 | 0.72mi |
| 4800 Kokomo Dr Sacramento, CA | 1.0–3.0 | 1.0–3.5 | 1229 | $3,819 | $3.11 | 2d | 26 | 0.79mi |
| 3530 Callison Dr Sacramento, CA | 4.0 | 2.5 | 2007 | $3,000 | $1.49 | 2d | 1 | 0.81mi |
| 5350 Dunlay Dr #911 Sacramento, CA | 3.0 | 2.0 | 1519 | $2,750 | $1.81 | 2d | 1 | 0.86mi |
| 5350 Dunlay Dr Sacramento, CA | 2.0–3.0 | 2.0 | 1585 | $2,750 | $1.74 | 18d | 3 | 0.87mi |
| 5350 Dunlay Dr Sacramento, CA | 2.0–3.0 | 2.0 | 1585 | $2,750 | $1.74 | 22d | 2 | 0.87mi |
| 3712 Bayou Rd Sacramento, CA | 3.0 | 2.5 | 1660 | $4,000 | $2.41 | 3d | 1 | 0.88mi |
| 5050 Trouville Ln Sacramento, CA | 3.0 | 2.5 | 1583 | $2,950 | $1.86 | 44d | 1 | 0.90mi |
| 3766 Bayou Rd Sacramento, CA | 3.0 | 2.5 | 1660 | $2,675 | $1.61 | 44d | 1 | 0.95mi |
| 3606 Damora Ave Sacramento, CA | 4.0 | 3.5 | 2362 | $3,900 | $1.65 | 44d | 1 | 1.03mi |
| 271 Vista Cove Cir Sacramento, CA | 5.0 | 3.0 | 2900 | $3,595 | $1.24 | 4d | 1 | 1.04mi |
| 2157 Promise Way Sacramento, CA | 4.0 | 3.0 | 2493 | $2,995 | $1.20 | 2d | 1 | 1.08mi |
| 4470 Saone Walk Sacramento, CA | 3.0–4.0 | 2.5–3.5 | 1846 | $2,950 | $1.60 | 2d | 1 | 1.20mi |
| 4441 Rhone Walk Sacramento, CA | 4.0 | 3.5 | 2298 | $2,950 | $1.28 | 44d | 1 | 1.26mi |
| 2957 Valbonne Walk Sacramento, CA | 4.0 | 3.5 | 2298 | $2,950 | $1.28 | 4d | 1 | 1.27mi |
| 17 Hertford Cir Sacramento, CA | 3.0 | 2.5 | 1511 | $2,450 | $1.62 | 24d | 1 | 1.28mi |
| 2957 Nimes Ln Sacramento, CA | 4.0 | 3.5 | 1920 | $2,795 | $1.46 | 44d | 1 | 1.33mi |
| 142 Mike Gartrell Cir Sacramento, CA | 4.0 | 3.0 | 2231 | $2,975 | $1.33 | 2d | 1 | 1.33mi |
| 301 Candela Cir Sacramento, CA | 3.0 | 2.5 | 1541 | $2,750 | $1.78 | 15d | 1 | 1.35mi |
| 620 Candela Cir Sacramento, CA | 3.0 | 2.5 | 1681 | $2,595 | $1.54 | 44d | 1 | 1.35mi |
| 5342 Liberty Ship Way Sacramento, CA | 4.0 | 4.0 | 2776 | $3,650 | $1.31 | 2d | 1 | 1.38mi |
HOA detail
- Monthly dues
- $73 · $876/yr
Listing history 2 events
-
2026-06-19remarks 699-char remark
-
2026-06-19$529,888 Active 1 DOM
ⓘ Source: listings_history table (triggers on properties + properties_extension) + one-shot
backfill from property_details.listing_events for pre-trigger history.
Tax reassessment forecast CA · Resets to sale price
- Current annual tax
- $6,594 · $549/mo
- Projected year-2 tax
- $6,594 · $549/mo
- Expected delta
- $0/yr ($0/mo · 0.0%)
ⓘ Screening estimate from a state-policy table — verify with the county assessor before closing.
Climate risk First Street
- Flood 1/10 Low FEMA zone A99 · 0% chance over 30 yrs
- Wildfire 5/10 Major
- Heat 7/10 Severe 7 d/yr ≥103°F today · 15 d/yr by 30 yrs out
- Wind 1/10 Low
- Air quality 10/10 Extreme 29 unhealthy d/yr today · 33 by 30 yrs out
Nearby sold comps map
Loading sold comps map…
Walkable amenities ~0.75 mi
Loading nearby amenities…
Taxation est. · year 1
- Rental income
- $39,294
- − Mortgage interest
- −$29,682
- − Property taxes
- −$6,594
- − Insurance
- −$4,152
- − Repairs & maintenance
- −$3,143
- − Management
- −$3,143
- − HOA
- −$876
- − Depreciation
- −$15,415
- Taxable loss
- −$23,712
- Est. tax savings @ 24.0%
- +$5,691
- After-tax cash flow
- $-8,235/yr
For passive investors: Depreciation is non-cash, so a rental often shows a tax loss while cash-flowing — sheltering income. Rental losses are passive: they offset passive income freely, and up to $25,000/yr can offset ordinary (W-2) income if you actively participate and your MAGI is under $100k (phasing out to $0 by $150k); unused losses carry forward. On sale, claimed depreciation is recaptured at up to 25%, and gains may owe capital-gains tax (a 1031 exchange can defer both). Figures are a year-1 estimate at your 24.0% rate — not tax advice; consult a CPA.
Schools (NCES district)
- District
- Natomas Unified
- NCES district ID
- 0600036
- Math proficiency
- 33% ▼ -1.00%
- Reading proficiency
- 60% ▲ 13.00%
- Median HH income
- $67,969
- Composite
- 41.49/100
- National rank
- #3457
- State rank
- #155 of 517 in CA
Livability — Sacramento
- Score
- 71/100
- State rank
- #218
- US rank
- #6957
Category grades
Schools grade is shown separately in the Schools card above.
Census & demographics
- Census place
- Sacramento, CA
- County
- Sacramento County · 1,539,646 people
- City population
- 761,410
- Metro
- Sacramento-Roseville-Folsom, CA
- Population (ZIP)
- 42,004
- Household income
- $114,468
- Rent vs Own
- Severe rent burden
- 1234.0
Population outlook (Sacramento County) Hauer SSP2
- Today (2025)
- 1,660,763 people
- By 2030
- 1,732,990 · +4.3%
- By 2040
- 1,855,755 · +11.7%
- By 2050
- 1,941,335 · +16.9%
- By 2075
- 2,046,162 · +23.2%
- By 2100
- 1,961,444 · +18.1%
Race, ethnicity, and origin ACS 2023
- Neighborhood character
- Highly diverse neighborhood (Simpson 0.78)
- Race & ethnicity
- Asian 30% White 29% Hispanic / Latino 19% Two or more races 15% Black 13%
- Hispanic origin (detail)
- Mexican 15%
- Common ancestry
- Scotch-Irish 2% Italian 1% Romanian 1%
- Foreign-born
- 25% · China, Canada, Vietnam
- Languages at home
- 66% English-only · Other Indo-European 10% Spanish 8% Other Asian/Pacific 4%
Political lean MEDSL · Sacramento
- 2024 margin
- D (+19.7) · D 58.1% · R 38.4% · Other 3.5%
- 2008→2024 swing
- +0.7pp no change · 2008: 19.0pp · 2024: 19.7pp
- All cycles
- 2024: D+19.7 2020: D+25.3 2016: D+23.7 2012: D+16.3 2008: D+19.0
Not yet ingested
- Civics
- —
Market trends
- HPI YoY
- ▲ 9.18%
- Current HPI
- 271.4823
- Rent YoY
- ▲ 1.43%
- Metro
- Sacramento-Roseville-Folsom, CA
- State GDP YoY
- ▲ 3.21%
- F500 in state
- 116
Industry mix (Fortune 500 HQ in CA)
| Industry | F500 HQs | Revenue |
|---|---|---|
| Technology | 27 | $1,492B |
|
||
| Financial Services | 3 | $174B |
|
||
| Retail | 3 | $44B |
|
||
| Insurance | 3 | $26B |
|
||
| Media / Entertainment | 2 | $115B |
|
||
| Pharmaceuticals / Biotech | 2 | $62B |
|
||
Price history
-7.0% since first listed3 events — show timeline
- 2024-08-21 Rental Removed $2,975 APPFOLIO
- 2024-07-31 Price Changed $2,975 APPFOLIO
- 2024-07-19 Listed for Rent $3,200 APPFOLIO
Property tax history
+8.2%/yrLatest (2025): $6,594 · -3.0% YoY. Source: county tax records.
Cash-flow waterfall
monthlySold comps — $/sqft
last 12 mo · ≤1 miLoading sold comps…