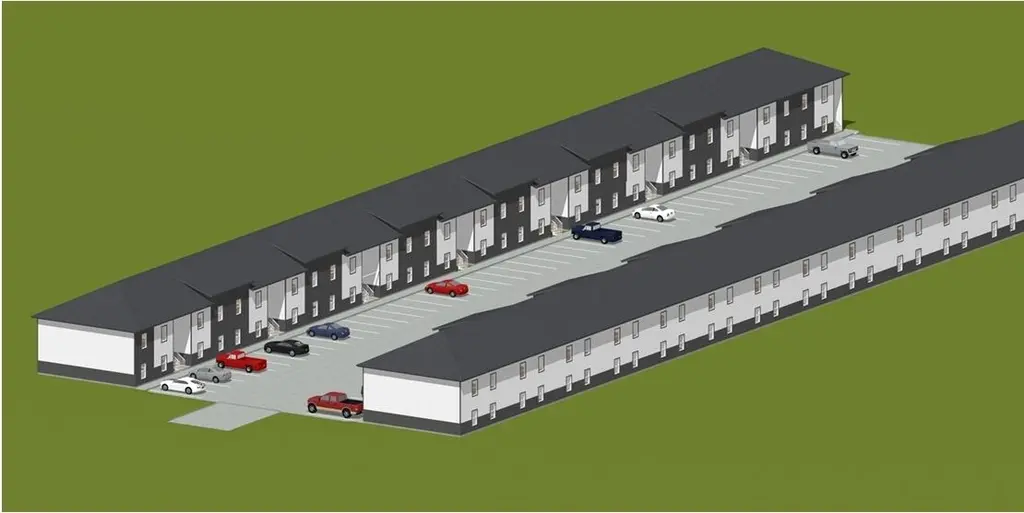
5015 FM 408, Orange, TX
Orange, TX 77630
$145,000C-
None bd · None ba ·
58,020 sqft ·
Built —
· MultiFamily
· Active
· 24 DOM
Cashflow @ list (25.0% down · 7.5%)
Estimated rent
$63,227/mo
Mortgage (P&I)
−$760
Tax + insurance
−$242
HOA
−$0
Vac / Maint / Mgmt
−$13,278
Net cashflow
$48,947/mo
Annual
$587,367/yr
Cap rate
411.37%
Cash-on-cash
1446.72%
DSCR
65.37
1% rule
43.60%
Cash to close
$40,600
Investor read
- This is a 60 × 1-bed/1-bath units multifamily listed at $145k. Condition is rated excellent.
- At list price, monthly cash flow is $49k ($587k/yr) — positive. Per door: $816/mo.
- The deal already cash-flows at list — no discount required.
- Meets the 1% rule at list price ($63k rent vs $145k).
- It's been on market 24 days — a 2% lower offer ($143k) is reasonable based on typical stale-listing flexibility.
- Recommended offer: $143k (1.5% below list) — sets the bar for market timing.
- In year one you build about $2k of equity ($1k loan paydown + $1k appreciation (1.0% local appreciation)).
- Location reads 71/100 on livability (#286 in TX) — a middle-class / working-renter tenant base. Strengths: cost of living A+, housing A+, health & safety A+; Watch: crime D+, employment D+, schools D-.
- Orangefield ISD (rural): math 44% / reading 48% proficiency, ranked #217 of 826 in TX (top 26%) — families likely to look elsewhere, expect single-tenant / working-renter base with shorter leases.
- Market conditions: Rents rising fast (+5.7%/yr); 337 active listings in the ZIP; 235 units permitted in Orange County in 2024 (50 in 5+ unit buildings).
- Orange County population projected at +6% by 2050 — modest demand growth; plan on rents tracking national, not racing it.
- At projected returns (1.0% appreciation + 5.7% rent growth), your $41k cash investment doubles in ~1 year — after that, you're playing with house money.
- Climate carrying-cost: major flood risk; severe wind risk, 99% chance of damaging wind over 30y; extreme-heat days projected 7→23/yr by 2055 (HVAC capex compounding) — expect insurance premiums to compound above CPI over the hold.
- Cap rate 411.4% vs local median 3.9% in Orange — top-decile yield for the area; either an underpriced asset or a hidden risk that comps aren't pricing in. Stress-test before assuming the spread holds.
- At $63,227/mo this rent would consume 1179% of the median local household income ($64k/yr) (locally 1018% of renters already pay >50% of income on rent) — very limited rent-growth headroom before tenants either downsize or default.
Questions for listing agent
- Can we see the unit-by-unit rent roll, current vacancy, and any below-market leases? What's the average tenancy length?
- What capital expenditures (roof, boiler, parking lot, exteriors) have been made in the last 5 years, and what's planned in the next 2?
- Is there a deadline driving the sale (1031 exchange, divorce, estate, relocation)? That informs how much negotiation room exists.
- Schools are D-rated, which usually means shorter tenancies and higher turnover. Who's the typical renter profile here, and what's been the actual vacancy rate?
- Crime grade is D in this area — have there been break-ins, vandalism, or insurance claims at this property in the last 3 years? What carrier currently insures it and at what premium?
- What's the average days-on-market for RENTAL listings here right now (not sales)? A rising rental-DOM trend means longer vacancies and softer asking-rent achievability than the comps imply.
- What's the recent tenant-quality profile in this submarket — average credit score on applications, eviction rate, late-payment / NSF rate, and stable-employment percentage? A property-management company in the area should have these aggregated.
- How much new apartment / multifamily construction is in the pipeline within 1–3 miles? Heavy new supply (>2% of stock underway) typically softens rents 12–24 months out; light construction supports rent growth.
CashFlowRE · CFR-HHM6350SAM5RN6
· Data 2 days ago
cashflowre.app · 2026-05-29