 60-Plex
5015 FM 408, Orange, TX · Orange, TX
Flood risk 6/10 · Moderate
- FEMA flood zone
- X (shaded)
- Chance of flooding over 30 yrs
- 0.58%
- Est. flood insurance / yr
- $507 – $1,088
Fire risk 4/10 · Minor
- Est. fire insurance / yr
- $1,222 – $2,270
Heat risk 9/10 · Severe
- Hot days now (above 109°F)
- 7 days/yr
- Hot days in 30 yrs
- 23 days/yr
Wind risk 9/10 · Severe
- Chance of severe wind over 30 yrs
- 99.0%
Air-quality risk 2/10 · Minimal
- Unhealthy air days now
- 1 days/yr
- Unhealthy air days in 30 yrs
- 1 days/yr
Risk factors via First Street. Map © Google.
Why this score? — see what drove the C- grade
The composite is a weighted blend of 9 inputs, each scored 0–100. Each bar is that input's sub-score; the figure is the points it added to the 100-point composite (weight × sub-score).
- Cash flow +15.0/30.0
- ARV discount +7.5/15.0
- Appreciation +5.5/10.0
- 1% rule +5.0/10.0
- DSCR +5.0/10.0
- Condition / age +5.0/5.0
- Schools +4.1/10.0
- Rent growth +3.9/5.0
- Livability +3.6/5.0
$145,000
🖨 Deal sheet 📄 Offer letter ✓ Due diligence
Multi-family units
County records classify this as Multi-Family (2-4 Unit). Listing-text estimate: 60 units. estimate disagrees with records
Listing remarks
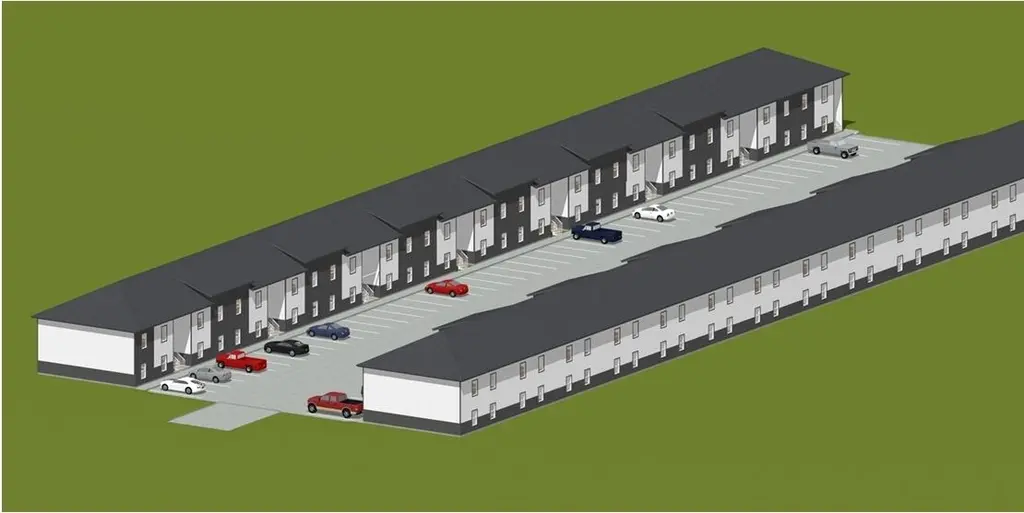
60-unit multifamily development opportunity in Orange, TX located within the highly regarded Orangefield ISD. Situated on approximately 2.38 acres, the property includes plans in hand and is ready for development. Proposed project consists of two 30-unit apartment buildings with plans already completed. City utilities available with electricity at the street. Great opportunity for developers looking for a multifamily project with substantial predevelopment work already completed.
Key facts
- Listed 24 days
Property features AI
Exterior
- Utilities: Public water service; Public sewer service
- Home design: Multi-family property (Residential Income)
- Construction: Information about year built and construction materials not provided
- Exterior features: Apartment complex (multi-family residential income property); Subdivision: OTHER
Neighborhood map
What this means for you Summary
Snapshot
- This is a 60 × 1-bed/1-bath units multifamily listed at $145k. Condition is rated excellent.
Deal economics
- At list price, monthly cash flow is $49k ($587k/yr) — positive. Per door: $816/mo.
- The deal already cash-flows at list — no discount required.
- Meets the 1% rule at list price ($63k rent vs $145k).
- Recommended offer: $143k (1.5% below list) — sets the bar for market timing.
- Cap rate 411.4% vs local median 3.9% in Orange — top-decile yield for the area; either an underpriced asset or a hidden risk that comps aren't pricing in. Stress-test before assuming the spread holds.
Location & tenants
- Location reads 71/100 on livability (#286 in TX) — a middle-class / working-renter tenant base. Strengths: cost of living A+, housing A+, health & safety A+; Watch: crime D+, employment D+, schools D-.
- Orangefield ISD (rural): math 44% / reading 48% proficiency, ranked #217 of 826 in TX (top 26%) — families likely to look elsewhere, expect single-tenant / working-renter base with shorter leases.
- Market conditions: Rents rising fast (+5.7%/yr); 337 active listings in the ZIP; 235 units permitted in Orange County in 2024 (50 in 5+ unit buildings).
- At $63,227/mo this rent would consume 1179% of the median local household income ($64k/yr) (locally 1018% of renters already pay >50% of income on rent) — very limited rent-growth headroom before tenants either downsize or default.
Forward outlook
- In year one you build about $2k of equity ($1k loan paydown + $1k appreciation (1.0% local appreciation)).
- Orange County population projected at +6% by 2050 — modest demand growth; plan on rents tracking national, not racing it.
- At projected returns (1.0% appreciation + 5.7% rent growth), your $41k cash investment doubles in ~1 year — after that, you're playing with house money.
Negotiation context
- It's been on market 24 days — a 2% lower offer ($143k) is reasonable based on typical stale-listing flexibility.
Risks & watch-outs
- Climate carrying-cost: major flood risk; severe wind risk, 99% chance of damaging wind over 30y; extreme-heat days projected 7→23/yr by 2055 (HVAC capex compounding) — expect insurance premiums to compound above CPI over the hold.
Questions for the listing agent
- Can we see the unit-by-unit rent roll, current vacancy, and any below-market leases? What's the average tenancy length?
- What capital expenditures (roof, boiler, parking lot, exteriors) have been made in the last 5 years, and what's planned in the next 2?
- Is there a deadline driving the sale (1031 exchange, divorce, estate, relocation)? That informs how much negotiation room exists.
- Schools are D-rated, which usually means shorter tenancies and higher turnover. Who's the typical renter profile here, and what's been the actual vacancy rate?
- Crime grade is D in this area — have there been break-ins, vandalism, or insurance claims at this property in the last 3 years? What carrier currently insures it and at what premium?
- What's the average days-on-market for RENTAL listings here right now (not sales)? A rising rental-DOM trend means longer vacancies and softer asking-rent achievability than the comps imply.
- What's the recent tenant-quality profile in this submarket — average credit score on applications, eviction rate, late-payment / NSF rate, and stable-employment percentage? A property-management company in the area should have these aggregated.
- How much new apartment / multifamily construction is in the pipeline within 1–3 miles? Heavy new supply (>2% of stock underway) typically softens rents 12–24 months out; light construction supports rent growth.
Investment metrics
- 1% rule
- 43.60% ✓
- Cap rate
- 411.37%
- Cash-on-cash
- 1446.72%
- DSCR
- 65.37
- GRM
- 0.2
CMA / ARV
No comps found within radius.
Projected returns pro-forma
1.01% appreciation · 5.71% rent growth · sell at horizon
- IRR
- —
- Equity multiple
- 82.24×
- Total profit
- $3,298,280
- Equity at exit
- $49,575
- IRR
- —
- Equity multiple
- 190.30×
- Total profit
- $7,685,669
- Equity at exit
- $65,939
Cash invested: $40,600 (down + closing). Projections, not guarantees.
Landlord ↔ Tenant lean methodology
- Overall (STATE)
- 87 Strongly Landlord-Friendly
- State Texas
- 87 Strongly Landlord-Friendly · R+5
- County
- — inherits STATE
- City
- — inherits STATE
ZIP-level market 77630
- Home prices YoY
- 0.4%
- Rents YoY
- 5.7%
- Active inventory
- 337
- Price-to-rent
- 11.5×
Monthly cashflow live
- Estimated rent
- $63,227 medium interval (Pro) →
- Mortgage (P&I)
- −$760
- Tax est. 1.5%
- −$181 /mo · $2,175/yr
- Insurance
- −$60
- HOA
- −$0
- Vacancy / Maint / Mgmt
- −$13,278
- Net cashflow
- $48,947
Break-even live
60-unit breakdown (identical units grouped — click to expand)
| Units | Beds | Baths | Est. rent |
|---|---|---|---|
| 60× units | 1 | 1 | $63,240 |
| #1 | 1 | 1 | $1,054 |
| #2 | 1 | 1 | $1,054 |
| #3 | 1 | 1 | $1,054 |
| #4 | 1 | 1 | $1,054 |
| #5 | 1 | 1 | $1,054 |
| #6 | 1 | 1 | $1,054 |
| #7 | 1 | 1 | $1,054 |
| #8 | 1 | 1 | $1,054 |
| #9 | 1 | 1 | $1,054 |
| #10 | 1 | 1 | $1,054 |
| #11 | 1 | 1 | $1,054 |
| #12 | 1 | 1 | $1,054 |
| #13 | 1 | 1 | $1,054 |
| #14 | 1 | 1 | $1,054 |
| #15 | 1 | 1 | $1,054 |
| #16 | 1 | 1 | $1,054 |
| #17 | 1 | 1 | $1,054 |
| #18 | 1 | 1 | $1,054 |
| #19 | 1 | 1 | $1,054 |
| #20 | 1 | 1 | $1,054 |
| #21 | 1 | 1 | $1,054 |
| #22 | 1 | 1 | $1,054 |
| #23 | 1 | 1 | $1,054 |
| #24 | 1 | 1 | $1,054 |
| #25 | 1 | 1 | $1,054 |
| #26 | 1 | 1 | $1,054 |
| #27 | 1 | 1 | $1,054 |
| #28 | 1 | 1 | $1,054 |
| #29 | 1 | 1 | $1,054 |
| #30 | 1 | 1 | $1,054 |
| #31 | 1 | 1 | $1,054 |
| #32 | 1 | 1 | $1,054 |
| #33 | 1 | 1 | $1,054 |
| #34 | 1 | 1 | $1,054 |
| #35 | 1 | 1 | $1,054 |
| #36 | 1 | 1 | $1,054 |
| #37 | 1 | 1 | $1,054 |
| #38 | 1 | 1 | $1,054 |
| #39 | 1 | 1 | $1,054 |
| #40 | 1 | 1 | $1,054 |
| #41 | 1 | 1 | $1,054 |
| #42 | 1 | 1 | $1,054 |
| #43 | 1 | 1 | $1,054 |
| #44 | 1 | 1 | $1,054 |
| #45 | 1 | 1 | $1,054 |
| #46 | 1 | 1 | $1,054 |
| #47 | 1 | 1 | $1,054 |
| #48 | 1 | 1 | $1,054 |
| #49 | 1 | 1 | $1,054 |
| #50 | 1 | 1 | $1,054 |
| #51 | 1 | 1 | $1,054 |
| #52 | 1 | 1 | $1,054 |
| #53 | 1 | 1 | $1,054 |
| #54 | 1 | 1 | $1,054 |
| #55 | 1 | 1 | $1,054 |
| #56 | 1 | 1 | $1,054 |
| #57 | 1 | 1 | $1,054 |
| #58 | 1 | 1 | $1,054 |
| #59 | 1 | 1 | $1,054 |
| #60 | 1 | 1 | $1,054 |
| Total (60 units) | $63,227 | ||
UW: 25.0% down · 7.5% · 30yr · 1.5% tax · 5.0% vac · 8.0% maint · 8.0% mgmt
Financing live
Cash to close
- Down payment
- $36,250
- Closing costs
- $4,350
- Reserves months
- —
- Total cash needed
- —
Loan-product check · same deal, 3 products live
Conventional
25% down · 7.5% · 30yr
- Down + closing
- —
- Monthly P&I
- —
- Monthly cashflow
- —
- DSCR
- —
- Eligible?
- —
Personal DTI + credit; lowest rate.
DSCR
20% down · 8.5% · 30yr
- Down + closing
- —
- Monthly P&I
- —
- Monthly cashflow
- —
- DSCR
- —
- Eligible?
- —
No personal income docs; deal must DSCR.
Hard money
10% down · 12.0% · 12mo
- Down + closing
- —
- Monthly P&I
- —
- Monthly cashflow
- —
- DSCR
- —
- Eligible?
- —
Short-term bridge; refi at stabilization.
Listing history 16 events
-
2026-06-18days on market $145,000 Active 24 DOM
-
2026-06-17days on market $145,000 Active 23 DOM
-
2026-06-16days on market $145,000 Active 22 DOM
-
2026-06-15days on market $145,000 Active 21 DOM
-
2026-06-14days on market $145,000 Active 19 DOM
-
2026-06-13days on market $145,000 Active 18 DOM
-
2026-06-10days on market $145,000 Active 16 DOM
-
2026-06-09days on market $145,000 Active 15 DOM
-
2026-06-08days on market $145,000 Active 14 DOM
-
2026-06-07days on market $145,000 Active 13 DOM
-
2026-06-03days on market $145,000 Active 9 DOM
-
2026-06-02days on market $145,000 Active 8 DOM
-
2026-06-01days on market $145,000 Active 7 DOM
-
2026-05-31days on market $145,000 Active 6 DOM
-
2026-05-30days on market $145,000 Active 5 DOM
-
2026-05-25$145,000 Active
ⓘ Source: listings_history table (triggers on properties + properties_extension) + one-shot
backfill from property_details.listing_events for pre-trigger history.
Climate risk First Street
- Flood 6/10 Major FEMA zone X (shaded) · 58% chance over 30 yrs
- Wildfire 4/10 Moderate
- Heat 9/10 Extreme 7 d/yr ≥109°F today · 23 d/yr by 30 yrs out
- Wind 9/10 Extreme 99% chance of damaging wind over 30 yrs
- Air quality 2/10 Low 1 unhealthy d/yr today · 1 by 30 yrs out
Nearby sold comps map
Loading sold comps map…
Walkable amenities ~0.75 mi
Loading nearby amenities…
Taxation est. · year 1
- Rental income
- $758,724
- − Mortgage interest
- −$8,122
- − Property taxes
- −$2,175
- − Insurance
- −$725
- − Repairs & maintenance
- −$60,698
- − Management
- −$60,698
- − Depreciation
- −$4,218
- Taxable income
- $622,088
- Est. tax owed @ 24.0%
- −$149,301
- After-tax cash flow
- $438,066/yr
For passive investors: Depreciation is non-cash, so a rental often shows a tax loss while cash-flowing — sheltering income. Rental losses are passive: they offset passive income freely, and up to $25,000/yr can offset ordinary (W-2) income if you actively participate and your MAGI is under $100k (phasing out to $0 by $150k); unused losses carry forward. On sale, claimed depreciation is recaptured at up to 25%, and gains may owe capital-gains tax (a 1031 exchange can defer both). Figures are a year-1 estimate at your 24.0% rate — not tax advice; consult a CPA.
Condition & rehab AI · 3 photos
This 60-unit multifamily property is in excellent condition with no visible repairs needed. It offers a great opportunity for developers looking to capitalize on the Orangefield ISD market. Upgrades in landscaping and interior painting would further enhance its value.
Value-add opportunities
- Both Landscaping improvements — Enhances curb appeal and property value
- Both Painting exterior and interior — Fresh paint improves aesthetics and value
- Resale Upgrading appliances — Modern appliances attract more buyers
- Both Adding smart home features — Enhances comfort and marketability
Renovation cost estimate screening
Value-add ROI direction
- Both Landscaping improvements — Enhances curb appeal and property value ↑
- Both Painting exterior and interior — Fresh paint improves aesthetics and value ↑
- Resale Upgrading appliances — Modern appliances attract more buyers ↑
- Both Adding smart home features — Enhances comfort and marketability ↑
ⓘ Cost ranges are severity-bucket heuristics (US national rule-of-thumb). Get contractor quotes + a written scope before underwriting a rehab budget.
Schools (NCES district)
- District
- Orangefield ISD
- NCES district ID
- 4833780
- Math proficiency
- 44% ▬ 0.00%
- Reading proficiency
- 48% ▬ 0.00%
- Median HH income
- $63,682
- Composite
- 40.77/100
- National rank
- #3647
- State rank
- #217 of 826 in TX
Livability — Orange
- Score
- 71/100
- State rank
- #286
- US rank
- #6456
Category grades
Schools grade is shown separately in the Schools card above.
Census & demographics
- County
- Orange County · 87,112 people
- City population
- 22,976
- Metro
- Beaumont-Port Arthur, TX
- Population (ZIP)
- 28,983
- Household income
- $64,373
- Rent vs Own
- Severe rent burden
- 1018.0
Population outlook (Orange County) Hauer SSP2
- Today (2025)
- 88,065 people
- By 2030
- 89,591 · +1.7%
- By 2040
- 91,982 · +4.4%
- By 2050
- 93,023 · +5.6%
- By 2075
- 94,871 · +7.7%
- By 2100
- 88,155 · +0.1%
Race, ethnicity, and origin ACS 2023
- Neighborhood character
- Majority White (64%)
- Race & ethnicity
- White 64% Black 21% Hispanic / Latino 11% Two or more races 9%
- Hispanic origin (detail)
- Mexican 7%
- Common ancestry
- Lithuanian 13% Italian 1% Slovak 1%
- Foreign-born
- 5% · Canada
- Languages at home
- 91% English-only · Spanish 7% French/Haitian/Cajun 1% Other Asian/Pacific 1%
Political lean MEDSL · Orange
- 2024 margin
- Solid R (+66.8) · D 16.4% · R 83.1%
- 2008→2024 swing
- -19.6pp toward R · 2008: -47.1pp · 2024: -66.8pp
- All cycles
- 2024: R+66.8 2020: R+63.4 2016: R+61.9 2012: R+54.3 2008: R+47.1
Not yet ingested
- Civics
- —
Market trends
- HPI YoY
- ▲ 1.01%
- Current HPI
- 264.14
- Rent YoY
- ▲ 5.71%
- Metro
- Beaumont-Port Arthur, TX
- State GDP YoY
- ▲ 3.95%
- F500 in state
- 110
Industry mix (Fortune 500 HQ in TX)
| Industry | F500 HQs | Revenue |
|---|---|---|
| Energy | 16 | $1,198B |
|
||
| Technology | 5 | $198B |
|
||
| Engineering / Construction | 4 | $72B |
|
||
| Energy Services | 3 | $60B |
|
||
| Utilities | 3 | $41B |
|
||
| Healthcare | 2 | $330B |
|
||
Price history
1 event — show timeline
- 2026-05-25 Listed $145,000 BBOR
Cash-flow waterfall
monthlySold comps — $/sqft
last 12 mo · ≤1 miLoading sold comps…