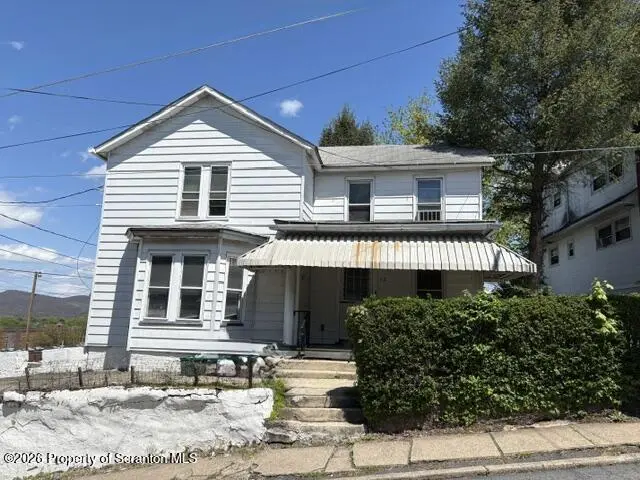
12 E Frothingham St
Pittston, PA 18640
$129,000C+
3 bd · 1.0 ba ·
1,524 sqft ·
Built 1930
· SingleFamily
· Pending
· 24 DOM
Cashflow @ list (25.0% down · 7.5%)
Estimated rent
$1,462/mo
Mortgage (P&I)
−$676
Tax + insurance
−$234
HOA
−$0
Vac / Maint / Mgmt
−$307
Net cashflow
$245/mo
Annual
$2,935/yr
Cap rate
8.57%
Cash-on-cash
8.13%
DSCR
1.36
1% rule
1.13%
Cash to close
$36,120
Investor read
- This is a 3-bed/1.0-bath single-family listed at $129k.
- At list price, monthly cash flow is $245 ($3k/yr) — positive.
- The deal already cash-flows at list — no discount required.
- Meets the 1% rule at list price ($1k rent vs $129k).
- It's been on market 24 days — a 2% lower offer ($127k) is reasonable based on typical stale-listing flexibility.
- Recommended offer: $127k (1.5% below list) — sets the bar for market timing.
- Local home prices are declining (-3.0%/yr); year-one equity from $892 of loan paydown is wiped out by about $4k of value loss. Plan a longer hold.
- Location reads 74/100 on livability (#493 in PA, #4,549 nationally) — a middle-class / working-renter tenant base. Strengths: crime A+, cost of living A+, health & safety A+; Watch: amenities F, commute F, employment F.
- Pittston Area SD (suburban): math 30% / reading 40% proficiency, ranked #418 of 539 in PA (top 78%) — families likely to look elsewhere, expect single-tenant / working-renter base with shorter leases.
- Zoned schools: Pittston City Intrmd Ctr (math 25% / reading 44%, grade F, #1,049 of 1,518 statewide, top 71%, 648 students, 63% FRL); Pittston Area Ms (math 6% / reading 36%, grade F, #432 of 512 statewide, top 85%, 964 students, 55% FRL); Pittston Area Shs (math 77% / reading 50%, grade B-, #69 of 437 statewide, top 16%, 1,022 students, 44% FRL).
- Watch-outs: built in 1930 — expect roof / HVAC / electrical / plumbing capex.
- Market conditions: 106 active listings in the ZIP; 15 comparable units currently listed for rent nearby; rentals at typical pace (median 23d on market — plan ~3-4 weeks tenant-placement turnaround); 47% of comp listings sitting > 30 days — soft ceiling on asking rent; 349 units permitted in Luzerne County in 2024 (16 in 5+ unit buildings).
- Luzerne County population projected at +4% by 2050 — modest demand growth; plan on rents tracking national, not racing it.
- Cap rate 8.6% vs local median 6.7% in Pittston — meaningfully above typical; check what's discounted (condition, days-on-market, listing class) to confirm the premium yield is real.
Questions for listing agent
- Built in 1930 — when were the roof, HVAC, electrical panel, plumbing, and water heater last replaced?
- Is there a deadline driving the sale (1031 exchange, divorce, estate, relocation)? That informs how much negotiation room exists.
- What's the average days-on-market for RENTAL listings here right now (not sales)? A rising rental-DOM trend means longer vacancies and softer asking-rent achievability than the comps imply.
- What's the recent tenant-quality profile in this submarket — average credit score on applications, eviction rate, late-payment / NSF rate, and stable-employment percentage? A property-management company in the area should have these aggregated.
- How much new for-sale + rental construction is in the pipeline within 1–3 miles? Heavy new supply typically softens prices + rents 12–24 months out; constrained supply supports both.
CashFlowRE · CFR-HK6CHK12T8G5YF
· Data 1 week ago
cashflowre.app · 2026-05-29