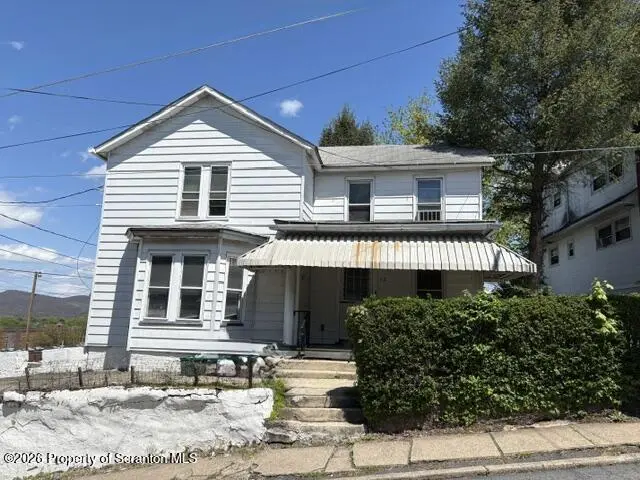
12 E Frothingham St · Pittston, PA
Flood risk 1/10 · Minimal
- FEMA flood zone
- X (unshaded)
- Chance of flooding over 30 yrs
- 0.0%
- Est. flood insurance / yr
- $507 – $1,088
Fire risk 1/10 · Minimal
- Est. fire insurance / yr
- $511 – $949
Heat risk 4/10 · Minor
- Hot days now (above 96°F)
- 7 days/yr
- Hot days in 30 yrs
- 16 days/yr
Wind risk 2/10 · Minimal
- Chance of severe wind over 30 yrs
- 3.0%
Air-quality risk 2/10 · Minimal
- Unhealthy air days now
- 1 days/yr
- Unhealthy air days in 30 yrs
- 2 days/yr
Risk factors via First Street. Map © Google.
Why this score? — see what drove the C+ grade
The composite is a weighted blend of 9 inputs, each scored 0–100. Each bar is that input's sub-score; the figure is the points it added to the 100-point composite (weight × sub-score).
- Cash flow +23.7/30.0
- ARV discount +13.6/15.0
- DSCR +7.6/10.0
- 1% rule +6.3/10.0
- Livability +3.7/5.0
- Schools +3.0/10.0
- Rent growth +2.5/5.0
- Condition / age +2.5/5.0
- Appreciation +0.0/10.0
$129,000
🖨 Deal sheet (PDF) 📄 Offer letter ✓ Due diligence
Listing remarks
Located in the desirable Pittston Area School District, this traditional two-story home offers classic charm and plenty of potential. The first floor features a formal living room, a comfortable family room, and an eat-in kitchen perfect for everyday dining. Some replacement windows have been installed in the kitchen, living room, and first-floor office. The office provides flexible space and could easily be converted into a fourth bedroom if desired. Laundry is located in the basement. Upstairs, you'll find three bedrooms and a full bathroom. In addition you will find a small room for additional storage or an office. With modern updates and a little TLC, this home could truly shine and bec
Key facts
- Flexible space
- Formal living room
- Eat-in kitchen
Tags
Property features AI
Finance
- HOA & community: Sidewalks
Exterior
- Parking: Driveway parking; On-street parking
- Utilities: Public water; Public sewer; 100 amp electric service; Natural gas connected; Electricity connected; Cable available
- Home design: Single-family house; Two levels; Built in 1930 (estimated)
- Construction: Aluminum siding; Composition/shingle roof; Concrete perimeter / stone / permanent foundation
- Exterior features: Private entrance; Front covered porch with awning(s)
Interior
- Kitchen: Gas oven; Refrigerator
- Bedrooms: 3 bedrooms
- Flooring: Carpet; Wood; Linoleum
- Bathrooms: 1 full bathroom
- Heating & cooling: Forced air heating; Natural gas heating; Coal stove; No central cooling
- Interior features: Drywall; Storage; Paneling; Attic storage; Has basement (dirt floor, unfinished)
- Laundry & utility: Washer; Dryer (laundry located in basement)
Neighborhood map
What this means for you Summary
Snapshot
- This is a 3-bed/1.0-bath single-family listed at $129k.
Deal economics
- At list price, monthly cash flow is $245 ($3k/yr) — positive.
- The deal already cash-flows at list — no discount required.
- Meets the 1% rule at list price ($1k rent vs $129k).
- Recommended offer: $127k (1.5% below list) — sets the bar for market timing.
- Cap rate 8.6% vs local median 6.7% in Pittston — meaningfully above typical; check what's discounted (condition, days-on-market, listing class) to confirm the premium yield is real.
Location & tenants
- Location reads 74/100 on livability (#493 in PA, #4,549 nationally) — a middle-class / working-renter tenant base. Strengths: crime A+, cost of living A+, health & safety A+; Watch: amenities F, commute F, employment F.
- Pittston Area SD (suburban): math 30% / reading 40% proficiency, ranked #418 of 539 in PA (top 78%) — families likely to look elsewhere, expect single-tenant / working-renter base with shorter leases.
- Zoned schools: Pittston City Intrmd Ctr (math 25% / reading 44%, grade F, #1,049 of 1,518 statewide, top 71%, 648 students, 63% FRL); Pittston Area Ms (math 6% / reading 36%, grade F, #432 of 512 statewide, top 85%, 964 students, 55% FRL); Pittston Area Shs (math 77% / reading 50%, grade B-, #69 of 437 statewide, top 16%, 1,022 students, 44% FRL).
- Market conditions: 106 active listings in the ZIP; 15 comparable units currently listed for rent nearby; rentals at typical pace (median 23d on market — plan ~3-4 weeks tenant-placement turnaround); 47% of comp listings sitting > 30 days — soft ceiling on asking rent; 349 units permitted in Luzerne County in 2024 (16 in 5+ unit buildings).
Forward outlook
- Local home prices are declining (-3.0%/yr); year-one equity from $892 of loan paydown is wiped out by about $4k of value loss. Plan a longer hold.
- Luzerne County population projected at +4% by 2050 — modest demand growth; plan on rents tracking national, not racing it.
Negotiation context
- It's been on market 24 days — a 2% lower offer ($127k) is reasonable based on typical stale-listing flexibility.
Risks & watch-outs
- Watch-outs: built in 1930 — expect roof / HVAC / electrical / plumbing capex.
Questions for the listing agent
- Built in 1930 — when were the roof, HVAC, electrical panel, plumbing, and water heater last replaced?
- Is there a deadline driving the sale (1031 exchange, divorce, estate, relocation)? That informs how much negotiation room exists.
- What's the average days-on-market for RENTAL listings here right now (not sales)? A rising rental-DOM trend means longer vacancies and softer asking-rent achievability than the comps imply.
- What's the recent tenant-quality profile in this submarket — average credit score on applications, eviction rate, late-payment / NSF rate, and stable-employment percentage? A property-management company in the area should have these aggregated.
- How much new for-sale + rental construction is in the pipeline within 1–3 miles? Heavy new supply typically softens prices + rents 12–24 months out; constrained supply supports both.
Investment metrics
- 1% rule
- 1.13% ✓
- Cap rate
- 8.57%
- Cash-on-cash
- 8.13%
- DSCR
- 1.36
- GRM
- 7.4
CMA / ARV
- ARV (on-the-fly)
- $149,352
- Comps found
- 12
Show comp detail 12 sales within ~0.75 mi
| Address | Dist | Beds/Ba | Sqft | Sold | Price | $/sf | Match |
|---|---|---|---|---|---|---|---|
| 54 Columbus Ave | 0.24mi | 3/1.5 | 1,536 (+1%) | 8mo | $149,000 | $97 | 79 |
| 1 Garfield St | 0.20mi | 3/1.0 | 1,380 (-9%) | 5mo | $120,000 | $87 | 71 |
| 156 Pine St | 0.37mi | 3/1.5 | 1,550 (+2%) | 8mo | $170,000 | $110 | 71 |
| 55 Welsh St | 0.44mi | 3/2.0 | 1,580 (+4%) | 2mo | $240,000 | $152 | 67 |
| 107 Johnson St | 0.26mi | 4/1.5 (+1) | 1,640 (+8%) | 4mo | $241,000 | $147 | 65 |
| 28 Pine St | 0.22mi | 4/1.5 (+1) | 1,350 (-11%) | 2mo | $90,000 | $67 | 62 |
| 179 Railroad St | 0.40mi | 2/1.0 (-1) | 1,420 (-7%) | 6mo | $95,000 | $67 | 60 |
| 181 Railroad St | 0.41mi | 3/1.0 | 1,656 (+9%) | 9mo | $107,000 | $65 | 59 |
| 16 Sand St | 0.67mi | 3/2.0 | 1,474 (-3%) | 5mo | $145,100 | $98 | 55 |
| 101 Mill St | 0.75mi | 3/1.5 | 1,600 (+5%) | 7mo | $250,000 | $156 | 49 |
| 34 Tedrick St | 0.68mi | 4/2.0 (+1) | 1,600 (+5%) | 6mo | $270,000 | $169 | 46 |
| 314 Excelsior St | 0.68mi | 3/2.0 | 1,400 (-8%) | 7mo | $135,000 | $96 | 45 |
Match score weights: distance 35% · size 25% · config 20% · recency 20%. Top-matched comps best support the ARV.
Projected returns pro-forma
-3.0% appreciation · 3.0% rent growth · sell at horizon
- IRR
- -3.9%
- Equity multiple
- 0.85×
- Total profit
- $-5,291
- Equity at exit
- $19,234
- IRR
- 5.8%
- Equity multiple
- 1.43×
- Total profit
- $15,588
- Equity at exit
- $11,154
Cash invested: $36,120 (down + closing). Projections, not guarantees.
Landlord ↔ Tenant lean methodology
- Overall (STATE)
- 62 Landlord-Friendly
- State Pennsylvania
- 62 Landlord-Friendly · EVEN
- County
- — inherits STATE
- City
- — inherits STATE
ZIP-level market 18640
- Home prices YoY
- -34.9%
- Active inventory
- 106
- Price-to-rent
- 7.4×
Monthly cashflow live
- Estimated rent
- $1,462 high interval (Pro) →
- Mortgage (P&I)
- −$676
- Tax from tax record
- −$180 /mo · $2,158/yr
- Insurance
- −$54
- HOA
- −$0
- Vacancy / Maint / Mgmt
- −$307
- Net cashflow
- $245
Break-even live
Sensitivity live
| Price | -10% $318 | -5% $281 | +0% $245 | +5% $208 | +10% $172 |
|---|---|---|---|---|---|
| Rent | -10% $129 | -5% $187 | +0% $245 | +5% $302 | +10% $360 |
| Rate | -1.0pp $310 | -0.5pp $277 | base $245 | +0.5pp $211 | +1.0pp $177 |
UW: 25.0% down · 7.5% · 30yr · 1.5% tax · 5.0% vac · 8.0% maint · 8.0% mgmt
Financing live
Cash to close
- Down payment
- $32,250
- Closing costs
- $3,870
- Reserves months
- —
- Total cash needed
- —
Loan-product check · same deal, 3 products live
Conventional
25% down · 7.5% · 30yr
- Down + closing
- —
- Monthly P&I
- —
- Monthly cashflow
- —
- DSCR
- —
- Eligible?
- —
Personal DTI + credit; lowest rate.
DSCR
20% down · 8.5% · 30yr
- Down + closing
- —
- Monthly P&I
- —
- Monthly cashflow
- —
- DSCR
- —
- Eligible?
- —
No personal income docs; deal must DSCR.
Hard money
10% down · 12.0% · 12mo
- Down + closing
- —
- Monthly P&I
- —
- Monthly cashflow
- —
- DSCR
- —
- Eligible?
- —
Short-term bridge; refi at stabilization.
Rent comps 15 comps
| Address | Beds | Baths | Sqft | Rent | $/sqft | DOM | Units | Dist |
|---|---|---|---|---|---|---|---|---|
| 252 S Main St Pittston, PA | 4.0 | 2.5 | 1548 | $1,750 | $1.13 | 45d | 1 | 0.10mi |
| 109 Main St Pittston, PA | 2.0–3.0 | 2.0 | 1070 | $1,300 | $1.21 | 15d | 1 | 0.22mi |
| 524 Spring St Pittston, PA | 2.0 | 1.0 | 1450 | $900 | $0.62 | 45d | 1 | 0.48mi |
| 524 Spring St #2 Jenkins Township, PA | 2.0 | 1.0 | 1300 | $925 | $0.71 | 45d | 1 | 0.48mi |
| 197 Rear Broad St Pittston, PA | 2.0 | 2.0 | 1800 | $1,350 | $0.75 | 45d | 1 | 0.59mi |
| 197 Rear Broad St Pittston, PA | 2.0 | 2.0 | 1600 | $1,350 | $0.84 | 15d | 1 | 0.59mi |
| 340 Race St West Pittston, PA | 3.0 | 1.5 | 1889 | $1,550 | $0.82 | 22d | 1 | 0.64mi |
| 211 Montgomery Ave Unit 211 West Pittston, PA | 3.0 | 2.0 | 1916 | $1,600 | $0.84 | 15d | 1 | 0.78mi |
| 202 Philadelphia Ave West Pittston, PA | 2.0 | 1.5 | 1550 | $1,600 | $1.03 | 15d | 1 | 0.80mi |
| 37 Hale St Yatesville, PA | 3.0 | 2.0 | 2050 | $1,600 | $0.78 | 45d | 1 | 0.96mi |
| 7 Miller St Pittston, PA | 2.0 | 1.0 | 1120 | $1,150 | $1.03 | 15d | 1 | 1.00mi |
| 327 Fremont St Unit 329 West Pittston, PA | 3.0 | 1.0 | 1250 | $1,400 | $1.12 | 45d | 1 | 1.16mi |
| 178 Parsonage St Pittston, PA | 3.0 | 1.0 | 1500 | $1,500 | $1.00 | 15d | 1 | 1.16mi |
| 329 Fremont St West Pittston, PA | 3.0 | 1.0 | 1250 | $1,400 | $1.12 | 45d | 1 | 1.17mi |
| 226 Fremont St West Pittston, PA | 3.0 | 2.0 | 1140 | $1,395 | $1.22 | 15d | 1 | 1.23mi |
Listing history 8 events
-
2026-06-09statusdays on market $129,000 Pending 24 DOM
-
2026-06-08days on market $129,000 Active 23 DOM
-
2026-06-07days on market $129,000 Active 22 DOM
-
2026-06-02days on market $129,000 Active 17 DOM
-
2026-06-01days on market $129,000 Active 16 DOM
-
2026-05-31days on market $129,000 Active 15 DOM
-
2026-05-30days on market $129,000 Active 14 DOM
-
2026-05-14$129,000 Active
ⓘ Source: listings_history table (triggers on properties + properties_extension) + one-shot
backfill from property_details.listing_events for pre-trigger history.
Tax reassessment forecast PA · Partial reset (capped growth)
- Current annual tax
- $2,158 · $180/mo
- Projected year-2 tax
- $2,158 · $180/mo
- Expected delta
- $0/yr ($0/mo · 0.0%)
ⓘ Screening estimate from a state-policy table — verify with the county assessor before closing.
Climate risk First Street
- Flood 1/10 Low FEMA zone X (unshaded) · 0% chance over 30 yrs
- Wildfire 1/10 Low
- Heat 4/10 Moderate 7 d/yr ≥96°F today · 16 d/yr by 30 yrs out
- Wind 2/10 Low 3% chance of damaging wind over 30 yrs
- Air quality 2/10 Low 1 unhealthy d/yr today · 2 by 30 yrs out
Nearby sold comps map
Loading sold comps map…
Walkable amenities ~0.75 mi
Loading nearby amenities…
Taxation est. · year 1
- Rental income
- $17,539
- − Mortgage interest
- −$7,226
- − Property taxes
- −$2,158
- − Insurance
- −$645
- − Repairs & maintenance
- −$1,403
- − Management
- −$1,403
- − Depreciation
- −$3,753
- Taxable income
- $951
- Est. tax owed @ 24.0%
- −$228
- After-tax cash flow
- $2,707/yr
For passive investors: Depreciation is non-cash, so a rental often shows a tax loss while cash-flowing — sheltering income. Rental losses are passive: they offset passive income freely, and up to $25,000/yr can offset ordinary (W-2) income if you actively participate and your MAGI is under $100k (phasing out to $0 by $150k); unused losses carry forward. On sale, claimed depreciation is recaptured at up to 25%, and gains may owe capital-gains tax (a 1031 exchange can defer both). Figures are a year-1 estimate at your 24.0% rate — not tax advice; consult a CPA.
Schools (NCES district)
- District
- Pittston Area SD
- NCES district ID
- 4219200
- Math proficiency
- 30% ▼ -12.00%
- Reading proficiency
- 40% ▼ -19.00%
- Median HH income
- $45,316
- Composite
- 29.86/100
- National rank
- #6409
- State rank
- #418 of 539 in PA
Livability — Pittston
- Score
- 74/100
- State rank
- #493
- US rank
- #4549
Category grades
Schools grade is shown separately in the Schools card above.
Census & demographics
- Census place
- Pittston, PA
- Population (ZIP)
- 16,418
Population outlook (Luzerne County) Hauer SSP2
- Today (2025)
- 319,505 people
- By 2030
- 319,943 · +0.1%
- By 2040
- 322,643 · +1.0%
- By 2050
- 330,817 · +3.5%
- By 2075
- 379,145 · +18.7%
- By 2100
- 431,908 · +35.2%
Race, ethnicity, and origin ACS 2023
- Neighborhood character
- Predominantly White (85%)
- Race & ethnicity
- White 85% Hispanic / Latino 6% Two or more races 5% Black 4%
- Hispanic origin (detail)
- Puerto Rican 4%
- Common ancestry
- Romanian 19% Scotch-Irish 2% Iranian 1%
- Foreign-born
- 3% · Canada, Jamaica
- Languages at home
- 93% English-only · Spanish 4% Other Indo-European 1% Chinese 1%
Political lean MEDSL · Luzerne
- 2024 margin
- R (+19.2) · D 40.0% · R 59.2%
- 2008→2024 swing
- -27.6pp toward R · 2008: 8.4pp · 2024: -19.2pp
- All cycles
- 2024: R+19.2 2020: R+14.4 2016: R+19.6 2012: D+4.8 2008: D+8.4
Not yet ingested
- Civics
- —
Market trends
- HPI YoY
- ▼ -102.89%
- Current HPI
- 191.973
- Rent YoY
- —
- Metro
- —
- State GDP YoY
- ▲ 1.68%
- F500 in state
- 34
Industry mix (Fortune 500 HQ in PA)
| Industry | F500 HQs | Revenue |
|---|---|---|
| Healthcare | 2 | $309B |
|
||
| Insurance | 2 | $27B |
|
||
| Telecommunications / Media | 1 | $124B |
|
||
| Industrial Distribution | 1 | $22B |
|
||
| Financial Services | 1 | $20B |
|
||
| Chemicals / Materials | 1 | $18B |
|
||
Price history
1 event — show timeline
- 2026-05-14 Listed $129,000 GSBR as distributed by MLS GRID
Property tax history
+1.4%/yrLatest (2026): $2,158 · +4.5% YoY. Source: county tax records.
Cash-flow waterfall
monthlySold comps — $/sqft
last 12 mo · ≤1 miLoading sold comps…