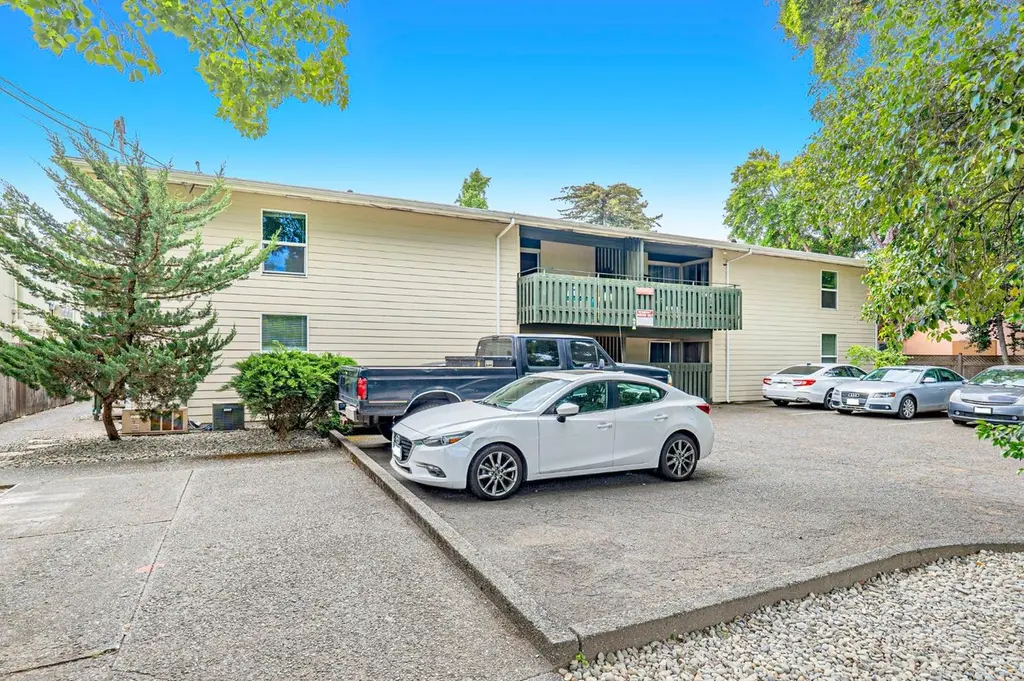
240 2nd St
Davis, CA 95616
$2,695,000D
16 bd · 8.0 ba ·
6,592 sqft ·
Built 1964
· MultiFamily
· Pending
· 35 DOM
Cashflow @ list (25.0% down · 7.5%)
Estimated rent
$21,242/mo
Mortgage (P&I)
−$14,133
Tax + insurance
−$3,012
HOA
−$0
Vac / Maint / Mgmt
−$4,461
Net cashflow
$-363/mo
Annual
$-4,362/yr
Cap rate
6.13%
Cash-on-cash
-0.58%
DSCR
0.97
1% rule
0.79%
Cash to close
$754,600
Investor read
- This is a 8 × 2-bed/1-bath units multifamily listed at $2.69M.
- At list price, monthly cash flow is $-363 ($-4k/yr) — negative. Per door: $-45/mo.
- To cash-flow at today's rent, offer at most $2.63M (2.4% below list).
- To meet the 1% rule (rent ≥ 1% of price), the offer needs to be $2.12M (21.2% below list).
- It's been on market 35 days — a 3% lower offer ($2.61M) is reasonable based on typical stale-listing flexibility.
- Recommended offer: $2.12M (21.2% below list) — sets the bar for 1% rule.
- Local home prices are declining (-3.0%/yr); year-one equity from $19k of loan paydown is wiped out by about $81k of value loss. Plan a longer hold.
- Location reads 78/100 on livability (#71 in CA, #2,713 nationally) — a middle-class / working-renter tenant base. Strengths: schools A+, amenities A+, commute A+; Watch: cost of living F.
- Davis Joint Unified (suburban): math 76% / reading 89% proficiency, ranked #28 of 517 in CA (top 5%) — strong family-tenant draw, lease renewals of 3-5y typical; only 18% free/reduced lunch — higher-income household profile.
- Market conditions: Rents rising (+1.8%/yr); 128 active listings in the ZIP; 721 units permitted in Yolo County in 2024 (260 in 5+ unit buildings).
- Yolo County population projected at +31% by 2050 — long-run rental-demand tailwind backs the buy-and-hold thesis.
- Current owner paid $447k; list at $2.69M implies a 503% gain — meaningful room to come down on a strong offer.
- Climate carrying-cost: extreme-heat days projected 6→13/yr by 2055 (HVAC capex compounding) — expect insurance premiums to compound above CPI over the hold.
- Cap rate 6.1% vs local median 2.0% in Davis — top-decile yield for the area; either an underpriced asset or a hidden risk that comps aren't pricing in. Stress-test before assuming the spread holds.
- At $21,242/mo this rent would consume 343% of the median local household income ($74k/yr) (locally 5678% of renters already pay >50% of income on rent) — very limited rent-growth headroom before tenants either downsize or default.
Questions for listing agent
- What do current leases actually rent for vs. the listed asking? Can we see a recent rent roll and the last 12 months of T-12 income?
- It's been on market 35 days. Have you received any prior offers? Is the seller open to a 21% concession, seller financing, or rate buy-down credit?
- Can we see the unit-by-unit rent roll, current vacancy, and any below-market leases? What's the average tenancy length?
- What capital expenditures (roof, boiler, parking lot, exteriors) have been made in the last 5 years, and what's planned in the next 2?
- Built in 1964 — when were the roof, HVAC, electrical panel, plumbing, and water heater last replaced?
- Is there a deadline driving the sale (1031 exchange, divorce, estate, relocation)? That informs how much negotiation room exists.
- Schools are A-rated — typically a magnet for longer-tenancy family renters. What's the average tenant stay here, and is there a school-zone premium baked into asking?
- The area grade is low — what's the realistic commute time and amenity access for the typical tenant pool here? Any planned neighborhood developments (good or bad) we should know about?
CashFlowRE · CFR-HKNV5VFAQRT2B7
· Data 3 weeks ago
cashflowre.app · 2026-05-29