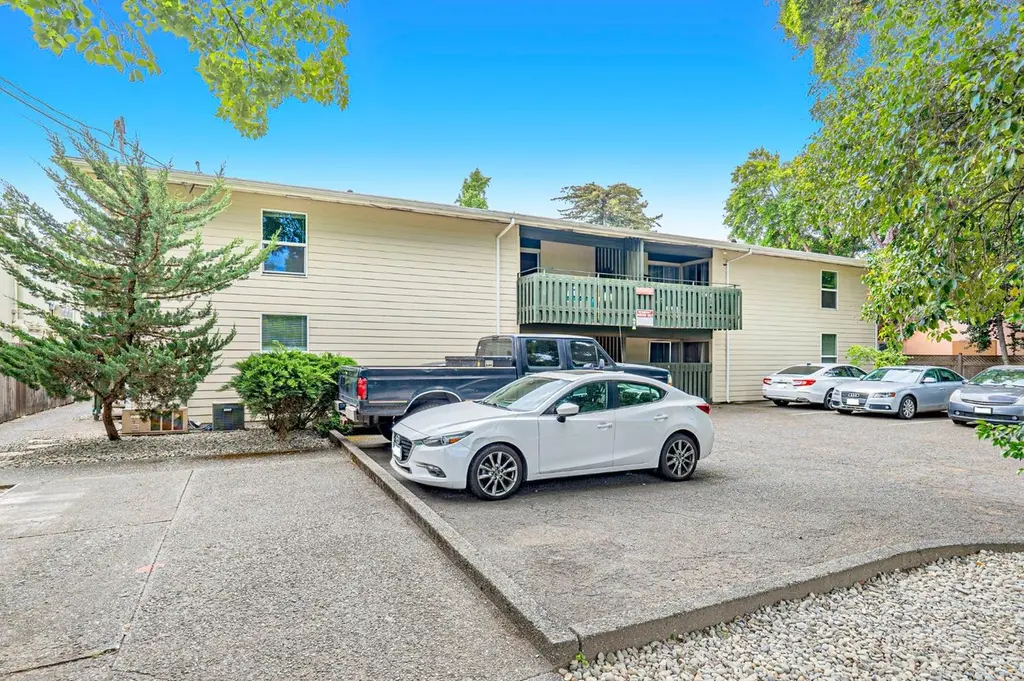
 8-Plex
240 2nd St · Davis, CA
Flood risk 1/10 · Minimal
- FEMA flood zone
- X (unshaded)
- Chance of flooding over 30 yrs
- 0.0%
- Est. flood insurance / yr
- $507 – $1,088
Fire risk 2/10 · Minimal
- Est. fire insurance / yr
- $659 – $1,223
Heat risk 6/10 · Moderate
- Hot days now (above 103°F)
- 6 days/yr
- Hot days in 30 yrs
- 13 days/yr
Wind risk 1/10 · Minimal
- Chance of severe wind over 30 yrs
- —
Air-quality risk 10/10 · Severe
- Unhealthy air days now
- 26 days/yr
- Unhealthy air days in 30 yrs
- 29 days/yr
Risk factors via First Street. Map © Google.
Why this score? — see what drove the D grade
The composite is a weighted blend of 9 inputs, each scored 0–100. Each bar is that input's sub-score; the figure is the points it added to the 100-point composite (weight × sub-score).
- Cash flow +12.6/30.0
- Schools +7.1/10.0
- ARV discount +5.9/15.0
- Livability +3.9/5.0
- DSCR +3.7/10.0
- Rent growth +3.0/5.0
- 1% rule +2.9/10.0
- Condition / age +2.5/5.0
- Appreciation +0.0/10.0
$2,695,000
🖨 Deal sheet 📄 Offer letter ✓ Due diligence
Multi-family units
County records classify this as Multi-Family (5+ Unit). Listing-text estimate: 8 units. confirmed
5+ unit building — per-unit beds/baths from public records are typically unavailable; the breakdown below (if shown) is an estimate from the listing text.
Listing remarks
Well-located 8-unit apartment building in the heart of Downtown Davis, just two blocks from UC Davis and within walking distance to restaurants, shopping, the Davis Farmers Market, and the Amtrak train station. Opportunities to acquire apartment properties in this immediate area are extremely limited, with very few sales occurring over the past decade, making this a rare offering in one of the most sought-after rental markets in Northern California. This highly desirable location supports strong and consistent rental demand driven by the university, excellent walkability, and limited housing supply. The property consists of eight 2 bedroom, 1 bath units (16 bedrooms total) and is currently
Key facts
- Strong rental demand
- Fully occupied
- 0.24 acre lot
Tags
Neighborhood map
What this means for you Summary
Snapshot
- This is a 8 × 2-bed/1-bath units multifamily listed at $2.69M.
Deal economics
- At list price, monthly cash flow is $-363 ($-4k/yr) — negative. Per door: $-45/mo.
- To cash-flow at today's rent, offer at most $2.63M (2.4% below list).
- To meet the 1% rule (rent ≥ 1% of price), the offer needs to be $2.12M (21.2% below list).
- Recommended offer: $2.12M (21.2% below list) — sets the bar for 1% rule.
- Cap rate 6.1% vs local median 2.0% in Davis — top-decile yield for the area; either an underpriced asset or a hidden risk that comps aren't pricing in. Stress-test before assuming the spread holds.
Location & tenants
- Location reads 78/100 on livability (#71 in CA, #2,713 nationally) — a middle-class / working-renter tenant base. Strengths: schools A+, amenities A+, commute A+; Watch: cost of living F.
- Davis Joint Unified (suburban): math 76% / reading 89% proficiency, ranked #28 of 517 in CA (top 5%) — strong family-tenant draw, lease renewals of 3-5y typical; only 18% free/reduced lunch — higher-income household profile.
- Market conditions: Rents rising (+1.8%/yr); 128 active listings in the ZIP; 721 units permitted in Yolo County in 2024 (260 in 5+ unit buildings).
- At $21,242/mo this rent would consume 343% of the median local household income ($74k/yr) (locally 5678% of renters already pay >50% of income on rent) — very limited rent-growth headroom before tenants either downsize or default.
Forward outlook
- Local home prices are declining (-3.0%/yr); year-one equity from $19k of loan paydown is wiped out by about $81k of value loss. Plan a longer hold.
- Yolo County population projected at +31% by 2050 — long-run rental-demand tailwind backs the buy-and-hold thesis.
Negotiation context
- It's been on market 35 days — a 3% lower offer ($2.61M) is reasonable based on typical stale-listing flexibility.
- Current owner paid $447k; list at $2.69M implies a 503% gain — meaningful room to come down on a strong offer.
Risks & watch-outs
- Climate carrying-cost: extreme-heat days projected 6→13/yr by 2055 (HVAC capex compounding) — expect insurance premiums to compound above CPI over the hold.
Questions for the listing agent
- What do current leases actually rent for vs. the listed asking? Can we see a recent rent roll and the last 12 months of T-12 income?
- It's been on market 35 days. Have you received any prior offers? Is the seller open to a 21% concession, seller financing, or rate buy-down credit?
- Can we see the unit-by-unit rent roll, current vacancy, and any below-market leases? What's the average tenancy length?
- What capital expenditures (roof, boiler, parking lot, exteriors) have been made in the last 5 years, and what's planned in the next 2?
- Built in 1964 — when were the roof, HVAC, electrical panel, plumbing, and water heater last replaced?
- Is there a deadline driving the sale (1031 exchange, divorce, estate, relocation)? That informs how much negotiation room exists.
- Schools are A-rated — typically a magnet for longer-tenancy family renters. What's the average tenant stay here, and is there a school-zone premium baked into asking?
- The area grade is low — what's the realistic commute time and amenity access for the typical tenant pool here? Any planned neighborhood developments (good or bad) we should know about?
- What's the average days-on-market for RENTAL listings here right now (not sales)? A rising rental-DOM trend means longer vacancies and softer asking-rent achievability than the comps imply.
- What's the recent tenant-quality profile in this submarket — average credit score on applications, eviction rate, late-payment / NSF rate, and stable-employment percentage? A property-management company in the area should have these aggregated.
- How much new apartment / multifamily construction is in the pipeline within 1–3 miles? Heavy new supply (>2% of stock underway) typically softens rents 12–24 months out; light construction supports rent growth.
Investment metrics
- 1% rule
- 0.79% ✗
- Cap rate
- 6.13%
- Cash-on-cash
- -0.58%
- DSCR
- 0.97
- GRM
- 10.6
CMA / ARV
- ARV (median comp)
- $2,600,000
- List price
- $2,695,000
- Delta
- 3.65%
- Verdict
- FAIR
- Comps
- 1 within 2.0 mi
Show comp detail 1 sale within ~0.75 mi
| Address | Dist | Beds/Ba | Sqft | Sold | Price | $/sf | Match |
|---|---|---|---|---|---|---|---|
| 240 2nd St | 0.00mi | 16/4.0 | 6,592 (0%) | 1mo | $2,600,000 | $394 | 84 |
Match score weights: distance 35% · size 25% · config 20% · recency 20%. Top-matched comps best support the ARV.
Projected returns pro-forma
-3.0% appreciation · 1.81% rent growth · sell at horizon
- IRR
- -18.5%
- Equity multiple
- 0.36×
- Total profit
- $-485,582
- Equity at exit
- $401,833
- IRR
- -13.3%
- Equity multiple
- 0.26×
- Total profit
- $-555,743
- Equity at exit
- $233,014
Cash invested: $754,600 (down + closing). Projections, not guarantees.
Landlord ↔ Tenant lean methodology
- Overall (STATE)
- 18 Strongly Tenant-Friendly
- State California
- 18 Strongly Tenant-Friendly · D+13
- County
- — inherits STATE
- City
- — inherits STATE
ZIP-level market 95616
- Rents YoY
- 1.8%
- Active inventory
- 128
- Price-to-rent
- 84.6×
Monthly cashflow live
- Estimated rent
- $21,242 high interval (Pro) →
- Mortgage (P&I)
- −$14,133
- Tax from tax record
- −$1,889 /mo · $22,666/yr
- Insurance
- −$1,123
- HOA
- −$0
- Vacancy / Maint / Mgmt
- −$4,461
- Net cashflow
- $-363
Break-even live
8-unit breakdown (identical units grouped — click to expand)
| Units | Beds | Baths | Est. rent |
|---|---|---|---|
| 8× units | 2 | 1 | $21,240 |
| #1 | 2 | 1 | $2,655 |
| #2 | 2 | 1 | $2,655 |
| #3 | 2 | 1 | $2,655 |
| #4 | 2 | 1 | $2,655 |
| #5 | 2 | 1 | $2,655 |
| #6 | 2 | 1 | $2,655 |
| #7 | 2 | 1 | $2,655 |
| #8 | 2 | 1 | $2,655 |
| Total (8 units) | $21,242 | ||
UW: 25.0% down · 7.5% · 30yr · 1.5% tax · 5.0% vac · 8.0% maint · 8.0% mgmt
Financing live
Cash to close
- Down payment
- $673,750
- Closing costs
- $80,850
- Reserves months
- —
- Total cash needed
- —
Loan-product check · same deal, 3 products live
Conventional
25% down · 7.5% · 30yr
- Down + closing
- —
- Monthly P&I
- —
- Monthly cashflow
- —
- DSCR
- —
- Eligible?
- —
Personal DTI + credit; lowest rate.
DSCR
20% down · 8.5% · 30yr
- Down + closing
- —
- Monthly P&I
- —
- Monthly cashflow
- —
- DSCR
- —
- Eligible?
- —
No personal income docs; deal must DSCR.
Hard money
10% down · 12.0% · 12mo
- Down + closing
- —
- Monthly P&I
- —
- Monthly cashflow
- —
- DSCR
- —
- Eligible?
- —
Short-term bridge; refi at stabilization.
Listing history 1 events
-
1995-06-30soldstatus $447,000
ⓘ Source: listings_history table (triggers on properties + properties_extension) + one-shot
backfill from property_details.listing_events for pre-trigger history.
Tax reassessment forecast CA · Resets to sale price
- Current annual tax
- $22,666 · $1,889/mo
- Projected year-2 tax
- $22,666 · $1,889/mo
- Expected delta
- $0/yr ($0/mo · 0.0%)
ⓘ Screening estimate from a state-policy table — verify with the county assessor before closing.
Climate risk First Street
- Flood 1/10 Low FEMA zone X (unshaded) · 0% chance over 30 yrs
- Wildfire 2/10 Low
- Heat 6/10 Major 6 d/yr ≥103°F today · 13 d/yr by 30 yrs out
- Wind 1/10 Low
- Air quality 10/10 Extreme 26 unhealthy d/yr today · 29 by 30 yrs out
Nearby sold comps map
Loading sold comps map…
Walkable amenities ~0.75 mi
Loading nearby amenities…
Taxation est. · year 1
- Rental income
- $254,904
- − Mortgage interest
- −$150,962
- − Property taxes
- −$22,666
- − Insurance
- −$13,475
- − Repairs & maintenance
- −$20,392
- − Management
- −$20,392
- − Depreciation
- −$78,400
- Taxable loss
- −$51,384
- Est. tax savings @ 24.0%
- +$12,332
- After-tax cash flow
- $7,971/yr
For passive investors: Depreciation is non-cash, so a rental often shows a tax loss while cash-flowing — sheltering income. Rental losses are passive: they offset passive income freely, and up to $25,000/yr can offset ordinary (W-2) income if you actively participate and your MAGI is under $100k (phasing out to $0 by $150k); unused losses carry forward. On sale, claimed depreciation is recaptured at up to 25%, and gains may owe capital-gains tax (a 1031 exchange can defer both). Figures are a year-1 estimate at your 24.0% rate — not tax advice; consult a CPA.
Schools (NCES district)
- District
- Davis Joint Unified
- NCES district ID
- 0610620
- Math proficiency
- 76% ▲ 11.00%
- Reading proficiency
- 89% ▲ 17.00%
- Median HH income
- $58,551
- Composite
- 70.5/100
- National rank
- #261
- State rank
- #28 of 517 in CA
Livability — Davis
- Score
- 78/100
- State rank
- #71
- US rank
- #2713
Category grades
Schools grade is shown separately in the Schools card above.
Census & demographics
- Census place
- Davis, CA
- County
- Yolo County · 212,115 people
- City population
- 79,897
- Metro
- Sacramento-Roseville-Folsom, CA
- Population (ZIP)
- 53,630
- Household income
- $74,359
- Rent vs Own
- Severe rent burden
- 5678.0
Population outlook (Yolo County) Hauer SSP2
- Today (2025)
- 242,183 people
- By 2030
- 257,662 · +6.4%
- By 2040
- 288,050 · +18.9%
- By 2050
- 318,202 · +31.4%
- By 2075
- 392,736 · +62.2%
- By 2100
- 438,150 · +80.9%
Race, ethnicity, and origin ACS 2023
- Neighborhood character
- Diverse neighborhood (Simpson 0.67)
- Race & ethnicity
- White 50% Asian 25% Hispanic / Latino 16% Two or more races 11% Black 2%
- Hispanic origin (detail)
- Mexican 10%
- Common ancestry
- Italian 9% Lithuanian 2% Slovak 2%
- Foreign-born
- 19% · China, Canada, South Korea
- Languages at home
- 68% English-only · Spanish 9% Chinese 8% Other Indo-European 4%
Political lean MEDSL · Yolo
- 2024 margin
- Solid D (+36.2) · D 66.3% · R 30.1% · Other 3.6%
- 2008→2024 swing
- 0.0pp no change · 2008: 36.2pp · 2024: 36.2pp
- All cycles
- 2024: D+36.2 2020: D+41.4 2016: D+42.0 2012: D+33.2 2008: D+36.2
Not yet ingested
- Civics
- —
Market trends
- HPI YoY
- ▼ -653.25%
- Current HPI
- 305.6271
- Rent YoY
- ▲ 1.81%
- Metro
- Sacramento-Roseville-Folsom, CA
- State GDP YoY
- ▲ 3.21%
- F500 in state
- 116
Industry mix (Fortune 500 HQ in CA)
| Industry | F500 HQs | Revenue |
|---|---|---|
| Technology | 27 | $1,492B |
|
||
| Financial Services | 3 | $174B |
|
||
| Retail | 3 | $44B |
|
||
| Insurance | 3 | $26B |
|
||
| Media / Entertainment | 2 | $115B |
|
||
| Pharmaceuticals / Biotech | 2 | $62B |
|
||
Price history
1 event — show timeline
- 1995-06-30 Sold (Public Records) $447,000 Public Records
Property tax history
+2.0%/yrLatest (2025): $22,666 · +2.3% YoY. Source: county tax records.
Cash-flow waterfall
monthlySold comps — $/sqft
last 12 mo · ≤1 miLoading sold comps…