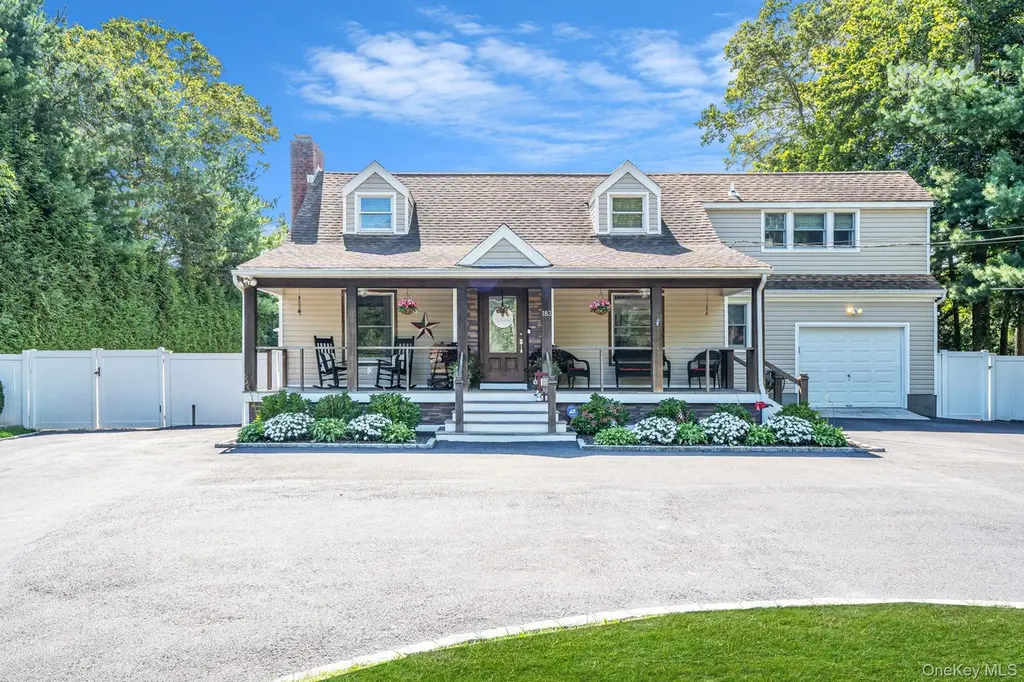
183 Old Country Rd
Remsenburg-Speonk, NY 11972
$859,000B+
4 bd · 2.0 ba ·
2,060 sqft ·
Built 1975
· SingleFamily
· Pending
· 34 DOM
Cashflow @ list (25.0% down · 7.5%)
Estimated rent
$26,523/mo
Mortgage (P&I)
−$4,505
Tax + insurance
−$1,151
HOA
−$0
Vac / Maint / Mgmt
−$5,570
Net cashflow
$15,298/mo
Annual
$183,573/yr
Cap rate
27.66%
Cash-on-cash
76.32%
DSCR
4.40
1% rule
3.09%
Cash to close
$240,520
Investor read
- This is a 4-bed/2.0-bath single-family listed at $859k.
- At list price, monthly cash flow is $15k ($184k/yr) — positive.
- The deal already cash-flows at list — no discount required.
- Meets the 1% rule at list price ($27k rent vs $859k).
- It's been on market 34 days — a 3% lower offer ($833k) is reasonable based on typical stale-listing flexibility.
- Recommended offer: $833k (3.0% below list) — sets the bar for market timing.
- In year one you build about $27k of equity ($6k loan paydown + $21k appreciation (2.5% local appreciation)).
- Location reads: area grade B — affects rentability + tenant quality, not the cash-flow math above.
- Eastport-South Manor CSD (suburban): math 62% / reading 69% proficiency, ranked #147 of 590 in NY (top 25%) — acceptable for families but not a draw, mixed tenant base, ~2y average lease; only 11% free/reduced lunch — higher-income household profile.
- Zoned schools: Eastport Elementary School (math 67% / reading 77%, grade A-, #378 of 2,108 statewide, top 20%, 348 students, 0% FRL); Eastport-South Manor Junior Senior High School (math 68% / reading 61%, grade B-, #776 of 1,100 statewide, top 73%, 1,530 students, 20% FRL) — zoned schools at 10% FRL track the district average.
- Market conditions: 6 active listings in the ZIP; 4 comparable units currently listed for rent nearby; rentals at typical pace (median 17d on market — plan ~3-4 weeks tenant-placement turnaround); 1,366 units permitted in Suffolk County in 2024 (216 in 5+ unit buildings).
- Suffolk County population projected to shrink 5% by 2050 — rents likely to lag national; underwrite the cash flow, not the appreciation.
- 2 sale attempts with the ask held roughly flat each time — persistent listings suggest the price (not the market) is what's stuck; bring a comps-based counter.
- Current owner paid $470k; list at $859k implies a 83% gain — meaningful room to come down on a strong offer.
- At projected returns (2.5% appreciation + 3.0% rent growth), your $241k cash investment doubles in ~2 years — after that, you're playing with house money.
- By year 3, paydown + projected appreciation supports a ~$68k cash-out refi (75% LTV) — recoverable capital for the next deal without selling this one.
- Climate carrying-cost: severe wind risk, 80% chance of damaging wind over 30y — expect insurance premiums to compound above CPI over the hold.
- Cap rate 27.7% vs local median 7.2% in Remsenburg-Speonk — top-decile yield for the area; either an underpriced asset or a hidden risk that comps aren't pricing in. Stress-test before assuming the spread holds.
Questions for listing agent
- It's been on market 34 days. Have you received any prior offers? Is the seller open to a 3% concession, seller financing, or rate buy-down credit?
- Built in 1975 — when were the roof, HVAC, electrical panel, plumbing, and water heater last replaced?
- Is there a deadline driving the sale (1031 exchange, divorce, estate, relocation)? That informs how much negotiation room exists.
- What's the average days-on-market for RENTAL listings here right now (not sales)? A rising rental-DOM trend means longer vacancies and softer asking-rent achievability than the comps imply.
- What's the recent tenant-quality profile in this submarket — average credit score on applications, eviction rate, late-payment / NSF rate, and stable-employment percentage? A property-management company in the area should have these aggregated.
- How much new for-sale + rental construction is in the pipeline within 1–3 miles? Heavy new supply typically softens prices + rents 12–24 months out; constrained supply supports both.
CashFlowRE · CFR-HMT4NM2NPY587C
· Data 3 weeks ago
cashflowre.app · 2026-05-29