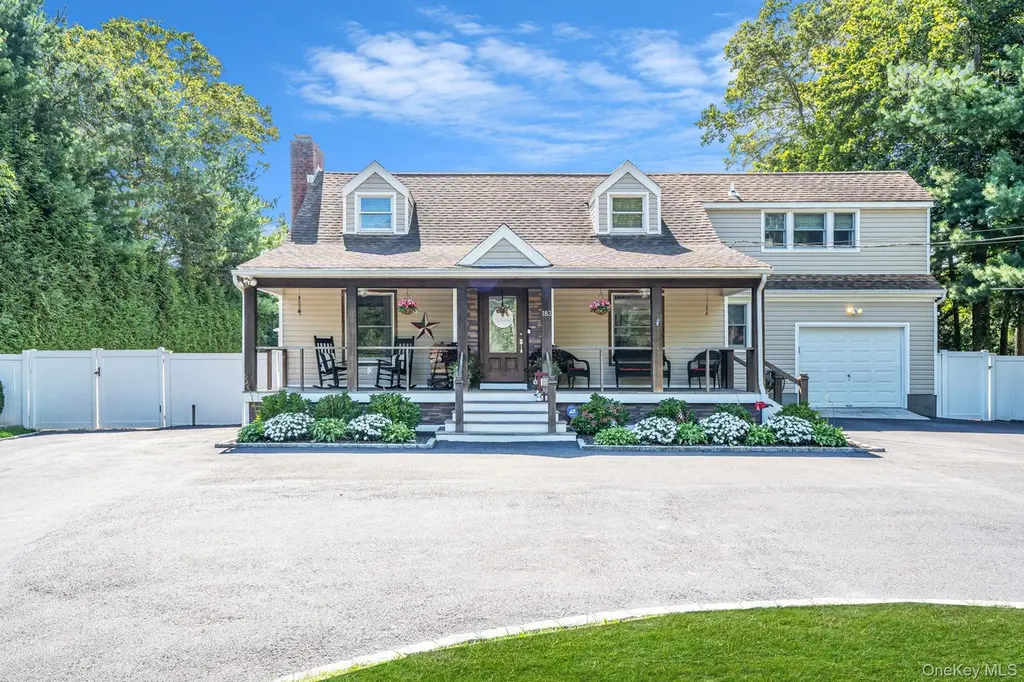
183 Old Country Rd · Remsenburg-Speonk, NY
Flood risk 3/10 · Minor
- FEMA flood zone
- X (unshaded)
- Chance of flooding over 30 yrs
- 0.2%
- Est. flood insurance / yr
- $473 – $860
Fire risk 3/10 · Minor
- Est. fire insurance / yr
- $691 – $1,283
Heat risk 4/10 · Minor
- Hot days now (above 91°F)
- 7 days/yr
- Hot days in 30 yrs
- 19 days/yr
Wind risk 8/10 · Major
- Chance of severe wind over 30 yrs
- 80.0%
Air-quality risk 4/10 · Minor
- Unhealthy air days now
- 4 days/yr
- Unhealthy air days in 30 yrs
- 5 days/yr
Risk factors via First Street. Map © Google.
Why this score? — see what drove the B+ grade
The composite is a weighted blend of 9 inputs, each scored 0–100. Each bar is that input's sub-score; the figure is the points it added to the 100-point composite (weight × sub-score).
- Cash flow +30.0/30.0
- 1% rule +10.0/10.0
- DSCR +10.0/10.0
- ARV discount +7.9/15.0
- Appreciation +6.2/10.0
- Schools +6.0/10.0
- Rent growth +2.5/5.0
- Livability +2.5/5.0
- Condition / age +2.5/5.0
$859,000
🖨 Deal sheet 📄 Offer letter ✓ Due diligence
Listing remarks
Welcome to this amazing 3-bedroom, 3-bathroom home in the exclusive Hamlet of Speonk, located within the Town of Southampton. Offering plenty of space and a thoughtful layout, this property is ideal for year-round living or as a second home close to the Hamptons and East End. The main level features a bright and inviting living area, a practical kitchen with quality appliances, and comfortable bedrooms with ample closet space. This Property has a full finished basement with a recreation room. For convenience and storage, the property includes both an attached garage and an additional detached garage, giving plenty of options for parking, hobbies, or a workshop. The exterior is beautiful and
Key facts
- Recreation room
- Attached garage
- Outdoor living
Tags
Property features AI
Exterior
- Parking: Driveway; Garage with automatic garage door opener; 1-car garage
- Utilities: Electric service by PSEG; Cesspool sewer system; Cable, electricity, and water connected
- Home design: Single family residence
- Construction: Frame construction
- Exterior features: Frame construction; Not waterfront
Interior
- Kitchen: Dishwasher; Gas oven and gas range; Microwave; Refrigerator; Stainless steel appliances
- Bedrooms: Rooms total include bedrooms within a 19-room layout
- Bathrooms: Three full bathrooms
- Heating & cooling: Oil heating; Central air conditioning
- Interior features: Breakfast bar; Galley-style and open kitchen areas; Pantry; Quartz/Quartzite counters; Finished basement
- Laundry & utility: Washer and dryer; Laundry located in the basement; Oil water heater
Neighborhood map
What this means for you Summary
Snapshot
- This is a 4-bed/2.0-bath single-family listed at $859k.
Deal economics
- At list price, monthly cash flow is $15k ($184k/yr) — positive.
- The deal already cash-flows at list — no discount required.
- Meets the 1% rule at list price ($27k rent vs $859k).
- Recommended offer: $833k (3.0% below list) — sets the bar for market timing.
- Cap rate 27.7% vs local median 7.2% in Remsenburg-Speonk — top-decile yield for the area; either an underpriced asset or a hidden risk that comps aren't pricing in. Stress-test before assuming the spread holds.
Location & tenants
- Location reads: area grade B — affects rentability + tenant quality, not the cash-flow math above.
- Eastport-South Manor CSD (suburban): math 62% / reading 69% proficiency, ranked #147 of 590 in NY (top 25%) — acceptable for families but not a draw, mixed tenant base, ~2y average lease; only 11% free/reduced lunch — higher-income household profile.
- Zoned schools: Eastport Elementary School (math 67% / reading 77%, grade A-, #378 of 2,108 statewide, top 20%, 348 students, 0% FRL); Eastport-South Manor Junior Senior High School (math 68% / reading 61%, grade B-, #776 of 1,100 statewide, top 73%, 1,530 students, 20% FRL) — zoned schools at 10% FRL track the district average.
- Market conditions: 6 active listings in the ZIP; 4 comparable units currently listed for rent nearby; rentals at typical pace (median 17d on market — plan ~3-4 weeks tenant-placement turnaround); 1,366 units permitted in Suffolk County in 2024 (216 in 5+ unit buildings).
Forward outlook
- In year one you build about $27k of equity ($6k loan paydown + $21k appreciation (2.5% local appreciation)).
- Suffolk County population projected to shrink 5% by 2050 — rents likely to lag national; underwrite the cash flow, not the appreciation.
- At projected returns (2.5% appreciation + 3.0% rent growth), your $241k cash investment doubles in ~2 years — after that, you're playing with house money.
- By year 3, paydown + projected appreciation supports a ~$68k cash-out refi (75% LTV) — recoverable capital for the next deal without selling this one.
Negotiation context
- It's been on market 34 days — a 3% lower offer ($833k) is reasonable based on typical stale-listing flexibility.
- 2 sale attempts with the ask held roughly flat each time — persistent listings suggest the price (not the market) is what's stuck; bring a comps-based counter.
- Current owner paid $470k; list at $859k implies a 83% gain — meaningful room to come down on a strong offer.
Risks & watch-outs
- Climate carrying-cost: severe wind risk, 80% chance of damaging wind over 30y — expect insurance premiums to compound above CPI over the hold.
Questions for the listing agent
- It's been on market 34 days. Have you received any prior offers? Is the seller open to a 3% concession, seller financing, or rate buy-down credit?
- Built in 1975 — when were the roof, HVAC, electrical panel, plumbing, and water heater last replaced?
- Is there a deadline driving the sale (1031 exchange, divorce, estate, relocation)? That informs how much negotiation room exists.
- What's the average days-on-market for RENTAL listings here right now (not sales)? A rising rental-DOM trend means longer vacancies and softer asking-rent achievability than the comps imply.
- What's the recent tenant-quality profile in this submarket — average credit score on applications, eviction rate, late-payment / NSF rate, and stable-employment percentage? A property-management company in the area should have these aggregated.
- How much new for-sale + rental construction is in the pipeline within 1–3 miles? Heavy new supply typically softens prices + rents 12–24 months out; constrained supply supports both.
Investment metrics
- 1% rule
- 3.09% ✓
- Cap rate
- 27.66%
- Cash-on-cash
- 76.32%
- DSCR
- 4.40
- GRM
- 2.7
CMA / ARV
- ARV (on-the-fly)
- $867,260
- Comps found
- 2
Show comp detail 2 sales within ~0.75 mi
| Address | Dist | Beds/Ba | Sqft | Sold | Price | $/sf | Match |
|---|---|---|---|---|---|---|---|
| 22 Howell Pl | 0.10mi | 4/3.0 | 2,300 (+12%) | 6mo | $835,000 | $363 | 67 |
| 10 East Pond Ln | 0.68mi | 4/2.5 | 1,900 (-8%) | 15mo | $800,000 | $421 | 41 |
Match score weights: distance 35% · size 25% · config 20% · recency 20%. Top-matched comps best support the ARV.
Projected returns pro-forma
2.48% appreciation · 3.0% rent growth · sell at horizon
- IRR
- 80.4%
- Equity multiple
- 5.39×
- Total profit
- $1,054,751
- Equity at exit
- $361,482
- IRR
- 80.3%
- Equity multiple
- 11.06×
- Total profit
- $2,419,352
- Equity at exit
- $538,551
Cash invested: $240,520 (down + closing). Projections, not guarantees.
Landlord ↔ Tenant lean methodology
- Overall (STATE)
- 15 Strongly Tenant-Friendly
- State New York
- 15 Strongly Tenant-Friendly · D+10
- County
- — inherits STATE
- City
- — inherits STATE
ZIP-level market 11972
- Home prices YoY
- 1.1%
- Active inventory
- 6
- Price-to-rent
- 2.7×
Monthly cashflow live
- Estimated rent
- $26,523 medium interval (Pro) →
- Mortgage (P&I)
- −$4,505
- Tax from tax record
- −$793 /mo · $9,517/yr
- Insurance
- −$358
- HOA
- −$0
- Vacancy / Maint / Mgmt
- −$5,570
- Net cashflow
- $15,298
Break-even live
UW: 25.0% down · 7.5% · 30yr · 1.5% tax · 5.0% vac · 8.0% maint · 8.0% mgmt
Financing live
Cash to close
- Down payment
- $214,750
- Closing costs
- $25,770
- Reserves months
- —
- Total cash needed
- —
Loan-product check · same deal, 3 products live
Conventional
25% down · 7.5% · 30yr
- Down + closing
- —
- Monthly P&I
- —
- Monthly cashflow
- —
- DSCR
- —
- Eligible?
- —
Personal DTI + credit; lowest rate.
DSCR
20% down · 8.5% · 30yr
- Down + closing
- —
- Monthly P&I
- —
- Monthly cashflow
- —
- DSCR
- —
- Eligible?
- —
No personal income docs; deal must DSCR.
Hard money
10% down · 12.0% · 12mo
- Down + closing
- —
- Monthly P&I
- —
- Monthly cashflow
- —
- DSCR
- —
- Eligible?
- —
Short-term bridge; refi at stabilization.
Rent comps 4 comps
| Address | Beds | Baths | Sqft | Rent | $/sqft | DOM | Units | Dist |
|---|---|---|---|---|---|---|---|---|
| 134A Montauk Hwy Westhampton, NY | 4.0 | 3.5 | 2478 | $15,000 | $6.05 | 1d | 1 | 1.27mi |
| 25 N Quarter Rd Westhampton, NY | 4.0 | 3.0 | 2000 | $30,000 | $15.00 | 16d | 1 | 1.36mi |
| 70 Jagger Ln Westhampton, NY | 3.0 | 2.0 | 1850 | $22,500 | $12.16 | 1d | 1 | 1.45mi |
| 510 Montauk Hwy Eastport, NY | 3.0 | 1.0 | 1450 | $3,250 | $2.24 | 43d | 1 | 1.46mi |
Listing history 9 events
-
2026-04-22status Pending
-
2026-03-19$859,000 Active
-
2026-03-18historical
-
2026-03-05price $870,500
-
2025-10-21price $869,999
-
2025-09-27$899,000 Active
-
2025-09-17historical
-
2020-03-16soldstatus $470,000
-
2002-08-20soldstatus $180,000
ⓘ Source: listings_history table (triggers on properties + properties_extension) + one-shot
backfill from property_details.listing_events for pre-trigger history.
Tax reassessment forecast NY · Partial reset (capped growth)
- Current annual tax
- $9,517 · $793/mo
- Projected year-2 tax
- $12,017 · $1,001/mo
- Expected delta
- +$2,500/yr (+$208/mo · 26.3%)
ⓘ Screening estimate from a state-policy table — verify with the county assessor before closing.
Climate risk First Street
- Flood 3/10 Moderate FEMA zone X (unshaded) · 20% chance over 30 yrs
- Wildfire 3/10 Moderate
- Heat 4/10 Moderate 7 d/yr ≥91°F today · 19 d/yr by 30 yrs out
- Wind 8/10 Severe 80% chance of damaging wind over 30 yrs
- Air quality 4/10 Moderate 4 unhealthy d/yr today · 5 by 30 yrs out
Nearby sold comps map
Loading sold comps map…
Walkable amenities ~0.75 mi
Loading nearby amenities…
Taxation est. · year 1
- Rental income
- $318,280
- − Mortgage interest
- −$48,117
- − Property taxes
- −$9,517
- − Insurance
- −$4,295
- − Repairs & maintenance
- −$25,462
- − Management
- −$25,462
- − Depreciation
- −$24,989
- Taxable income
- $180,437
- Est. tax owed @ 24.0%
- −$43,305
- After-tax cash flow
- $140,268/yr
For passive investors: Depreciation is non-cash, so a rental often shows a tax loss while cash-flowing — sheltering income. Rental losses are passive: they offset passive income freely, and up to $25,000/yr can offset ordinary (W-2) income if you actively participate and your MAGI is under $100k (phasing out to $0 by $150k); unused losses carry forward. On sale, claimed depreciation is recaptured at up to 25%, and gains may owe capital-gains tax (a 1031 exchange can defer both). Figures are a year-1 estimate at your 24.0% rate — not tax advice; consult a CPA.
Schools (NCES district)
- District
- Eastport-South Manor CSD
- NCES district ID
- 3600125
- Math proficiency
- 62% ▼ -1.00%
- Reading proficiency
- 69% ▲ 3.00%
- Median HH income
- $91,204
- Composite
- 59.55/100
- National rank
- #918
- State rank
- #147 of 590 in NY
Livability — Remsenburg-Speonk
No livability data for this city. (Only ~50 U.S. cities are tracked.)
Census & demographics
- Census place
- Remsenburg-Speonk, NY
- City population
- 1,346
- Population (ZIP)
- 309
Population outlook (Suffolk County) Hauer SSP2
- Today (2025)
- 1,505,262 people
- By 2030
- 1,498,318 · -0.5%
- By 2040
- 1,471,101 · -2.3%
- By 2050
- 1,424,848 · -5.3%
- By 2075
- 1,337,157 · -11.2%
- By 2100
- 1,217,720 · -19.1%
Race, ethnicity, and origin ACS 2023
- Neighborhood character
- Predominantly White (99%)
- Race & ethnicity
- White 99%
- Common ancestry
- Romanian 9%
- Foreign-born
- 4%
- Languages at home
- 92% English-only · Russian/Polish/Slavic 8%
Political lean MEDSL · Suffolk
- 2024 margin
- Lean R (+10.0) · D 45.0% · R 55.0%
- 2008→2024 swing
- -16.0pp toward R · 2008: 6.0pp · 2024: -10.0pp
- All cycles
- 2024: R+10.0 2020: R+0.0 2016: R+8.2 2012: D+2.9 2008: D+6.0
Not yet ingested
- Civics
- —
Market trends
- HPI YoY
- ▲ 2.48%
- Current HPI
- 231.8516
- Rent YoY
- —
- Metro
- —
- State GDP YoY
- ▲ 2.60%
- F500 in state
- 92
Industry mix (Fortune 500 HQ in NY)
| Industry | F500 HQs | Revenue |
|---|---|---|
| Financial Services | 10 | $950B |
|
||
| Consumer Goods | 9 | $162B |
|
||
| Insurance | 4 | $225B |
|
||
| Telecommunications | 2 | $144B |
|
||
| Pharmaceuticals | 2 | $112B |
|
||
| Media / Entertainment | 2 | $69B |
|
||
Price history
+377.2% since first listed9 events — show timeline
- 2026-04-22 Pending — OneKey® MLS as Distributed by MLS Grid
- 2026-03-19 Listed $859,000 OneKey® MLS as Distributed by MLS Grid
- 2026-03-18 Listing Removed — OneKey® MLS as Distributed by MLS Grid
- 2026-03-05 Price Changed $870,500 OneKey® MLS as Distributed by MLS Grid
- 2025-10-21 Price Changed $869,999 OneKey® MLS as Distributed by MLS Grid
- 2025-09-27 Listed $899,000 OneKey® MLS as Distributed by MLS Grid
- 2025-09-17 Coming Soon — OneKey® MLS as Distributed by MLS Grid
- 2020-03-16 Sold (Public Records) $470,000 Public Records
- 2002-08-20 Sold (Public Records) $180,000 Public Records
Property tax history
+3.9%/yrLatest (2024): $9,517 · +0.0% YoY. Source: county tax records.
Cash-flow waterfall
monthlySold comps — $/sqft
last 12 mo · ≤1 miLoading sold comps…