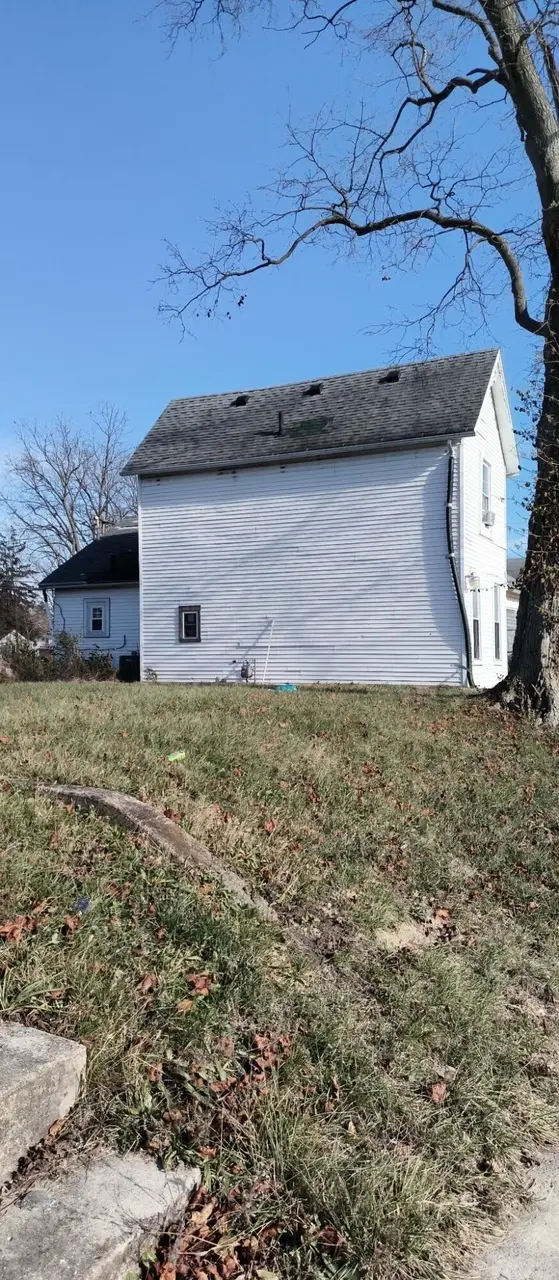
506 W Southern Ave
Springfield, OH 45506
$84,900C+
4 bd · 1.0 ba ·
2,120 sqft ·
Built 1881
· SingleFamily
· Active
· 405 DOM
Cashflow @ list (25.0% down · 7.5%)
Estimated rent
$1,711/mo
Mortgage (P&I)
−$445
Tax + insurance
−$104
HOA
−$0
Vac / Maint / Mgmt
−$359
Net cashflow
$802/mo
Annual
$9,629/yr
Cap rate
17.63%
Cash-on-cash
40.51%
DSCR
2.80
1% rule
2.01%
Cash to close
$23,772
Investor read
- This is a 4-bed/1.0-bath single-family listed at $85k.
- At list price, monthly cash flow is $802 ($10k/yr) — positive.
- The deal already cash-flows at list — no discount required.
- Meets the 1% rule at list price ($2k rent vs $85k).
- It's been on market 405 days — a 12% lower offer ($75k) is reasonable based on typical stale-listing flexibility.
- Recommended offer: $75k (12.0% below list) — sets the bar for market timing.
- Local home prices are declining (-3.0%/yr); year-one equity from $587 of loan paydown is wiped out by about $3k of value loss. Plan a longer hold.
- Location reads 56/100 on livability (#1,108 in OH) — a working-class tenant base; expect higher turnover. Strengths: cost of living A+, housing A+; Watch: crime F, amenities F, commute F.
- Springfield City School District (urban): math 20% / reading 27% proficiency, ranked #616 of 656 in OH (top 94%) — low school quality limits family demand, transient renter base, plan for 1-2y turnover; 75% free/reduced lunch — lower-income household profile, screen leases tightly.
- Zoned schools: Perrin Woods Elementary School (math 12% / reading 19%, grade F, #1,375 of 1,584 statewide, top 87%, 379 students, 0% FRL); Hayward Middle School (math 15% / reading 14%, grade F, #630 of 654 statewide, top 97%, 339 students, 0% FRL); Springfield High School (math 17% / reading 31%, grade F, #665 of 781 statewide, top 85%, 1,516 students, 0% FRL) — zoned schools average 0% FRL vs 75% district-wide (75 pts lower); this property's tenant base skews higher-income than the district average.
- Watch-outs: built in 1881 — expect roof / HVAC / electrical / plumbing capex.
- Market conditions: 45 active listings in the ZIP; 11 comparable units currently listed for rent nearby; rentals leasing fast (median 13d on market — plan ~1-2 weeks tenant-placement turnaround); lower-income renter base — watch delinquency; 232 units permitted in Clark County in 2024 (116 in 5+ unit buildings).
- Clark County population projected at -16% by 2050 — secular population decline; favor cash flow + early exit over multi-decade hold.
- 10 sale attempts since 17y ago with the ask held roughly flat each time — persistent listings suggest the price (not the market) is what's stuck; bring a comps-based counter.
- Current owner paid $28k; list at $85k implies a 209% gain — meaningful room to come down on a strong offer.
- At projected returns (-3.0% appreciation + 3.0% rent growth), your $24k cash investment doubles in ~3 years — after that, you're playing with house money.
- Cap rate 17.6% vs local median 4.8% in Springfield — top-decile yield for the area; either an underpriced asset or a hidden risk that comps aren't pricing in. Stress-test before assuming the spread holds.
- At $1,711/mo this rent would consume 49% of the median local household income ($42k/yr) (locally 684% of renters already pay >50% of income on rent) — very limited rent-growth headroom before tenants either downsize or default.
Questions for listing agent
- It's been on market 405 days. Have you received any prior offers? Is the seller open to a 12% concession, seller financing, or rate buy-down credit?
- Built in 1881 — when were the roof, HVAC, electrical panel, plumbing, and water heater last replaced?
- Why hasn't it sold? Are there any deal-killer items the seller is aware of (foundation, flood, title, zoning, code violations)?
- Is there a deadline driving the sale (1031 exchange, divorce, estate, relocation)? That informs how much negotiation room exists.
- Crime grade is F in this area — have there been break-ins, vandalism, or insurance claims at this property in the last 3 years? What carrier currently insures it and at what premium?
- What's the average days-on-market for RENTAL listings here right now (not sales)? A rising rental-DOM trend means longer vacancies and softer asking-rent achievability than the comps imply.
- What's the recent tenant-quality profile in this submarket — average credit score on applications, eviction rate, late-payment / NSF rate, and stable-employment percentage? A property-management company in the area should have these aggregated.
- How much new for-sale + rental construction is in the pipeline within 1–3 miles? Heavy new supply typically softens prices + rents 12–24 months out; constrained supply supports both.
CashFlowRE · CFR-HN1ABZ32B8HK87
· Data 6 days ago
cashflowre.app · 2026-05-29