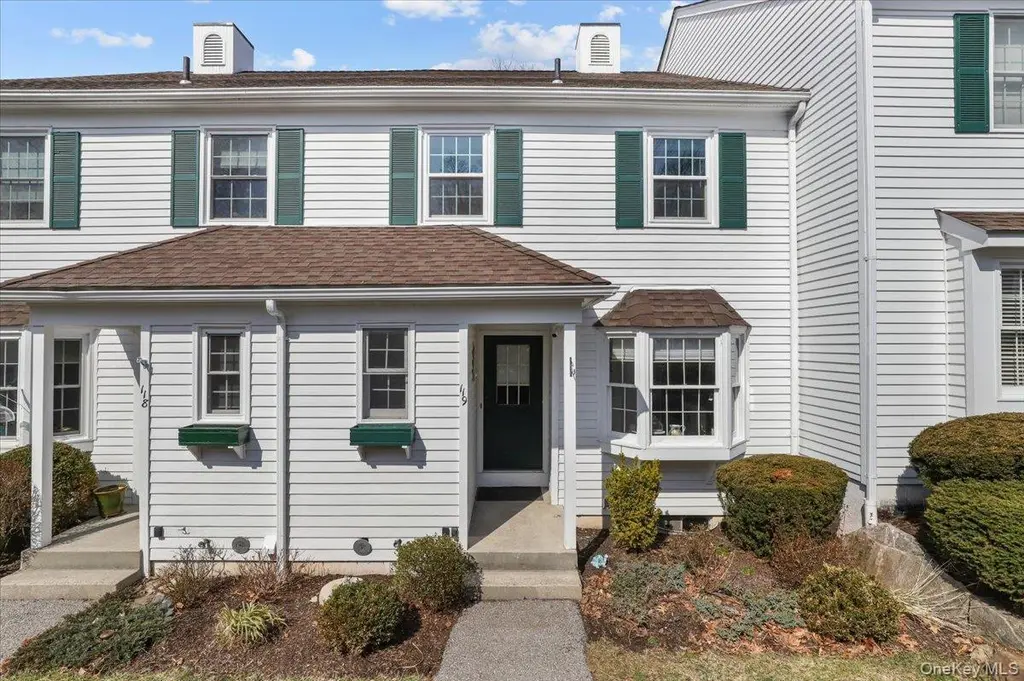
119 Willow Ct
Golden's Bridge, NY 10518
$524,000C+
1 bd · 1.5 ba ·
1,451 sqft ·
Built 1987
· SingleFamily
· Pending
· 23 DOM
Cashflow @ list (25.0% down · 7.5%)
Estimated rent
$5,554/mo
Mortgage (P&I)
−$2,748
Tax + insurance
−$739
HOA
−$550
Vac / Maint / Mgmt
−$1,166
Net cashflow
$351/mo
Annual
$4,207/yr
Cap rate
7.10%
Cash-on-cash
2.87%
DSCR
1.13
1% rule
1.06%
Cash to close
$146,720
Investor read
- This is a 1-bed/1.5-bath single-family listed at $524k.
- At list price, monthly cash flow is $351 ($4k/yr) — positive.
- The deal already cash-flows at list — no discount required.
- Meets the 1% rule at list price ($6k rent vs $524k).
- It's been on market 23 days — a 2% lower offer ($516k) is reasonable based on typical stale-listing flexibility.
- Recommended offer: $516k (1.5% below list) — sets the bar for market timing.
- In year one you build about $39k of equity ($4k loan paydown + $35k appreciation (6.7% local appreciation)).
- Location reads: area grade C — affects rentability + tenant quality, not the cash-flow math above.
- Katonah-Lewisboro Union Free School District (suburban): math 75% / reading 82% proficiency, ranked #32 of 590 in NY (top 5%) — strong family-tenant draw, lease renewals of 3-5y typical; only 3% free/reduced lunch — higher-income household profile.
- Zoned schools: Katonah Elementary School (math 72% / reading 82%, grade A, #244 of 2,108 statewide, top 13%, 407 students, 8% FRL); John Jay Middle School (math 58% / reading 79%, grade A, #94 of 729 statewide, top 13%, 662 students, 7% FRL); John Jay High School (math 98% / reading 82%, grade A+, #238 of 1,100 statewide, top 23%, 917 students, 9% FRL) — zoned schools at 8% FRL track the district average.
- Market conditions: 11 active listings in the ZIP; 954 units permitted in Westchester County in 2024 (649 in 5+ unit buildings).
- Westchester County population projected at +10% by 2050 — modest demand growth; plan on rents tracking national, not racing it.
- 4 sale attempts since 5y ago with the ask held roughly flat each time — persistent listings suggest the price (not the market) is what's stuck; bring a comps-based counter.
- Current owner paid $380k; 38% above their basis — modest negotiation headroom, anchor on the comps not their cost.
- At projected returns (6.7% appreciation + 3.0% rent growth), your $147k cash investment doubles in ~4 years — after that, you're playing with house money.
- By year 2, paydown + projected appreciation supports a ~$62k cash-out refi (75% LTV) — recoverable capital for the next deal without selling this one.
- Climate carrying-cost: moderate wind risk, 25% chance of damaging wind over 30y; extreme-heat days projected 7→17/yr by 2055 (HVAC capex compounding) — expect insurance premiums to compound above CPI over the hold.
- Cap rate 7.1% vs local median 1.3% in Golden's Bridge — top-decile yield for the area; either an underpriced asset or a hidden risk that comps aren't pricing in. Stress-test before assuming the spread holds.
Questions for listing agent
- What does the HOA fee cover, when was the last increase, and are there any pending special assessments or reserve-fund shortfalls?
- Is there a deadline driving the sale (1031 exchange, divorce, estate, relocation)? That informs how much negotiation room exists.
- What's the average days-on-market for RENTAL listings here right now (not sales)? A rising rental-DOM trend means longer vacancies and softer asking-rent achievability than the comps imply.
- What's the recent tenant-quality profile in this submarket — average credit score on applications, eviction rate, late-payment / NSF rate, and stable-employment percentage? A property-management company in the area should have these aggregated.
- How much new for-sale + rental construction is in the pipeline within 1–3 miles? Heavy new supply typically softens prices + rents 12–24 months out; constrained supply supports both.
CashFlowRE · CFR-HNMQ190NSCRDFD
· Data 3 weeks ago
cashflowre.app · 2026-05-29