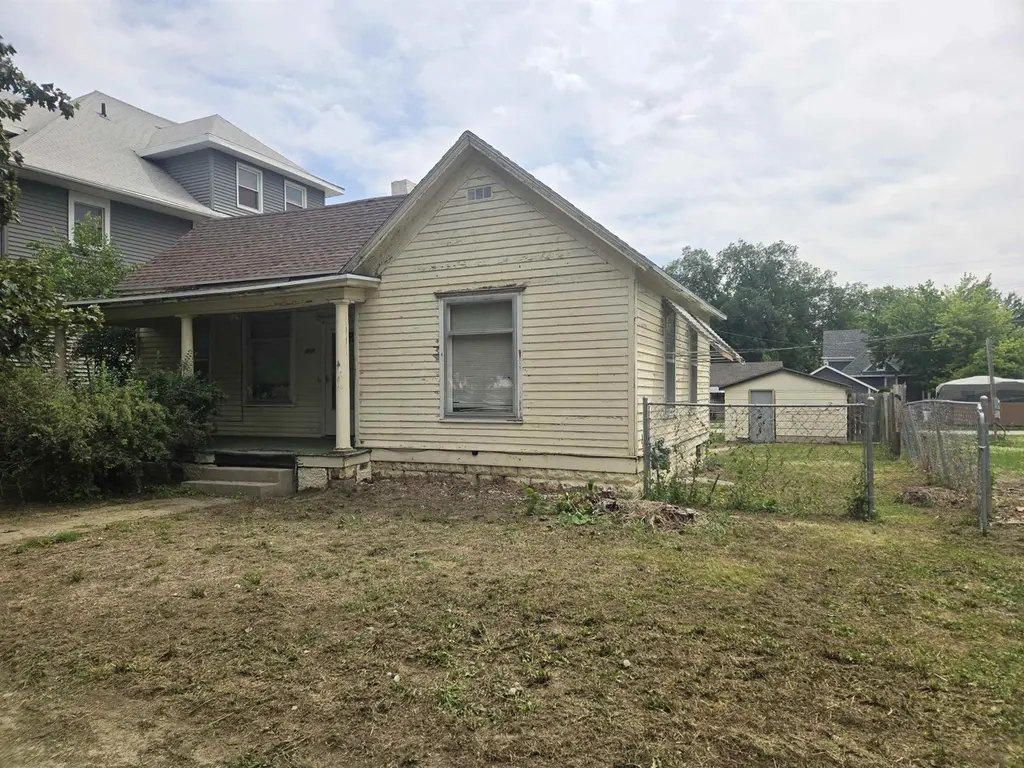
308 9th Steet St
Norfolk, NE 68701
$154,900C-
2 bd · 2.0 ba ·
854 sqft ·
Built 1910
· SingleFamily
· Active
· 21 DOM
Cashflow @ list (25.0% down · 7.5%)
Estimated rent
$1,266/mo
Mortgage (P&I)
−$812
Tax + insurance
−$131
HOA
−$0
Vac / Maint / Mgmt
−$266
Net cashflow
$56/mo
Annual
$676/yr
Cap rate
6.73%
Cash-on-cash
1.56%
DSCR
1.07
1% rule
0.82%
Cash to close
$43,372
Investor read
- This is a 2-bed/2.0-bath single-family listed at $155k.
- At list price, monthly cash flow is $56 ($676/yr) — positive.
- The deal already cash-flows at list — no discount required.
- To meet the 1% rule (rent ≥ 1% of price), the offer needs to be $127k (18.3% below list).
- It's been on market 21 days — a 2% lower offer ($153k) is reasonable based on typical stale-listing flexibility.
- Recommended offer: $127k (18.3% below list) — sets the bar for 1% rule.
- Local home prices are declining (-3.0%/yr); year-one equity from $1k of loan paydown is wiped out by about $5k of value loss. Plan a longer hold.
- Location reads 78/100 on livability (#54 in NE, #2,611 nationally) — a middle-class / working-renter tenant base. Strengths: cost of living A+, housing A+, health & safety A+; Watch: employment C-, amenities F, commute F.
- Norfolk Public Schools (town): math 44% / reading 46% proficiency, ranked #84 of 111 in NE (top 76%) — families likely to look elsewhere, expect single-tenant / working-renter base with shorter leases.
- Zoned schools: Grant Elementary School (math 27% / reading 47%, grade F, #373 of 502 statewide, top 77%, 228 students, 82% FRL); Norfolk Jr High School (math 38% / reading 40%, grade F, #95 of 128 statewide, top 76%, 641 students, 52% FRL); Norfolk Senior High School (math 44% / reading 38%, grade F, #180 of 261 statewide, top 69%, 1,346 students, 46% FRL) — zoned schools average 60% FRL vs 39% district-wide (21 pts higher); higher-poverty schools than district average — tighter screening recommended.
- Watch-outs: built in 1910 — expect roof / HVAC / electrical / plumbing capex.
- Market conditions: Rents rising (+3.3%/yr); 233 active listings in the ZIP; 14 comparable units currently listed for rent nearby; rentals lingering (median 46d on market — plan ~5-8 weeks vacancy on turnover, expect pricing pressure); 64% of comp listings sitting > 30 days — soft ceiling on asking rent; 270 units permitted in Madison County in 2024 (196 in 5+ unit buildings).
- Cap rate 6.7% vs local median 3.2% in Norfolk — top-decile yield for the area; either an underpriced asset or a hidden risk that comps aren't pricing in. Stress-test before assuming the spread holds.
Questions for listing agent
- Built in 1910 — when were the roof, HVAC, electrical panel, plumbing, and water heater last replaced?
- Is there a deadline driving the sale (1031 exchange, divorce, estate, relocation)? That informs how much negotiation room exists.
- Schools are B-rated — typically a magnet for longer-tenancy family renters. What's the average tenant stay here, and is there a school-zone premium baked into asking?
- What's the average days-on-market for RENTAL listings here right now (not sales)? A rising rental-DOM trend means longer vacancies and softer asking-rent achievability than the comps imply.
- What's the recent tenant-quality profile in this submarket — average credit score on applications, eviction rate, late-payment / NSF rate, and stable-employment percentage? A property-management company in the area should have these aggregated.
- How much new for-sale + rental construction is in the pipeline within 1–3 miles? Heavy new supply typically softens prices + rents 12–24 months out; constrained supply supports both.
CashFlowRE · CFR-HP9JBRBQPPK22N
· Data 16 h ago
cashflowre.app · 2026-05-29