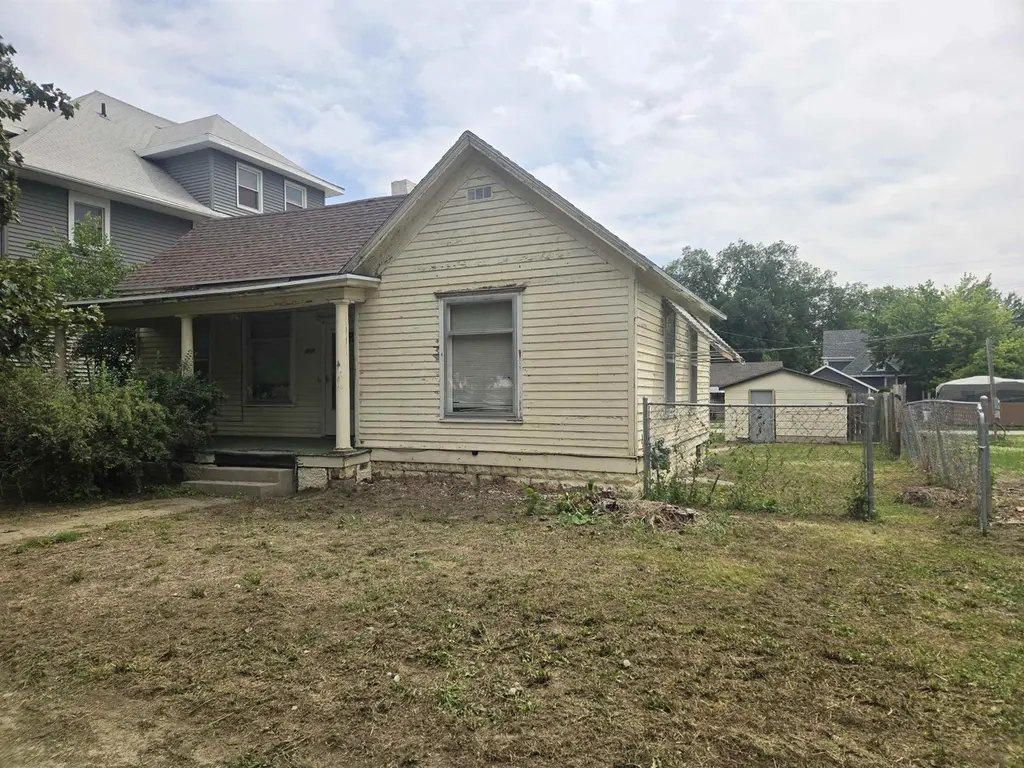
308 9th Steet St · Norfolk, NE
Flood risk 1/10 · Minimal
- FEMA flood zone
- X (unshaded)
- Chance of flooding over 30 yrs
- 0.0%
- Est. flood insurance / yr
- $473 – $860
Fire risk 1/10 · Minimal
- Est. fire insurance / yr
- $1,161 – $2,155
Heat risk 3/10 · Minor
- Hot days now (above 102°F)
- 7 days/yr
- Hot days in 30 yrs
- 15 days/yr
Wind risk 2/10 · Minimal
- Chance of severe wind over 30 yrs
- —
Air-quality risk 2/10 · Minimal
- Unhealthy air days now
- 1 days/yr
- Unhealthy air days in 30 yrs
- 1 days/yr
Risk factors via First Street. Map © Google.
Why this score? — see what drove the C- grade
The composite is a weighted blend of 9 inputs, each scored 0–100. Each bar is that input's sub-score; the figure is the points it added to the 100-point composite (weight × sub-score).
- Cash flow +15.3/30.0
- ARV discount +15.0/15.0
- DSCR +4.7/10.0
- Livability +3.9/5.0
- Schools +3.8/10.0
- Rent growth +3.3/5.0
- 1% rule +3.2/10.0
- Condition / age +2.5/5.0
- Appreciation +0.0/10.0
$154,900
🖨 Deal sheet (PDF) 📄 Offer letter ✓ Due diligence
Listing remarks
Whether you're looking to expand your investment portfolio or purchase your first rental property, or you are a first-time home buyer, this 2-bedroom home offers plenty of potential. Features include main-floor laundry for your convenience, newer flooring, updated kitchen with oven, dishwasher and refrigerator and a large fenced yard ideal for pets or outdoor activities Also, the detached garage offers alley access. The generous lot and practical layout provide excellent opportunities for future improvements and long-term value.
Key facts
- Alley access
- Generous lot
- Large fenced yard
Tags
Property features AI
Exterior
- Parking: 1-car garage with garage door opener
- Security: Smoke detectors
- Utilities: Public water; Public sewer; Natural gas available
- Home design: Single-family residential; Frame construction with wood siding
- Construction: Frame construction; Wood siding; Composition roof; Full basement
- Exterior features: Chain link fence; Composition roof
Interior
- Kitchen: Dishwasher; Electric range; Refrigerator; Garbage disposal
- Bedrooms: 2 main-level bedrooms
- Bathrooms: 1 main-level bathroom
- Heating & cooling: Central air conditioning; Forced air heating
- Interior features: Window coverings; Full basement
- Laundry & utility: Washer; Dryer; Gas water heater
Neighborhood map
What this means for you Summary
Snapshot
- This is a 2-bed/2.0-bath single-family listed at $155k.
Deal economics
- At list price, monthly cash flow is $56 ($676/yr) — positive.
- The deal already cash-flows at list — no discount required.
- To meet the 1% rule (rent ≥ 1% of price), the offer needs to be $127k (18.3% below list).
- Recommended offer: $127k (18.3% below list) — sets the bar for 1% rule.
- Cap rate 6.7% vs local median 3.2% in Norfolk — top-decile yield for the area; either an underpriced asset or a hidden risk that comps aren't pricing in. Stress-test before assuming the spread holds.
Location & tenants
- Location reads 78/100 on livability (#54 in NE, #2,611 nationally) — a middle-class / working-renter tenant base. Strengths: cost of living A+, housing A+, health & safety A+; Watch: employment C-, amenities F, commute F.
- Norfolk Public Schools (town): math 44% / reading 46% proficiency, ranked #84 of 111 in NE (top 76%) — families likely to look elsewhere, expect single-tenant / working-renter base with shorter leases.
- Zoned schools: Grant Elementary School (math 27% / reading 47%, grade F, #373 of 502 statewide, top 77%, 228 students, 82% FRL); Norfolk Jr High School (math 38% / reading 40%, grade F, #95 of 128 statewide, top 76%, 641 students, 52% FRL); Norfolk Senior High School (math 44% / reading 38%, grade F, #180 of 261 statewide, top 69%, 1,346 students, 46% FRL) — zoned schools average 60% FRL vs 39% district-wide (21 pts higher); higher-poverty schools than district average — tighter screening recommended.
- Market conditions: Rents rising (+3.3%/yr); 230 active listings in the ZIP; 14 comparable units currently listed for rent nearby; rentals lingering (median 46d on market — plan ~5-8 weeks vacancy on turnover, expect pricing pressure); 64% of comp listings sitting > 30 days — soft ceiling on asking rent; 270 units permitted in Madison County in 2024 (196 in 5+ unit buildings).
Forward outlook
- Local home prices are declining (-3.0%/yr); year-one equity from $1k of loan paydown is wiped out by about $5k of value loss. Plan a longer hold.
Negotiation context
- It's been on market 18 days — a 2% lower offer ($153k) is reasonable based on typical stale-listing flexibility.
Risks & watch-outs
- Watch-outs: built in 1910 — expect roof / HVAC / electrical / plumbing capex.
Questions for the listing agent
- Built in 1910 — when were the roof, HVAC, electrical panel, plumbing, and water heater last replaced?
- Is there a deadline driving the sale (1031 exchange, divorce, estate, relocation)? That informs how much negotiation room exists.
- Schools are B-rated — typically a magnet for longer-tenancy family renters. What's the average tenant stay here, and is there a school-zone premium baked into asking?
- What's the average days-on-market for RENTAL listings here right now (not sales)? A rising rental-DOM trend means longer vacancies and softer asking-rent achievability than the comps imply.
- What's the recent tenant-quality profile in this submarket — average credit score on applications, eviction rate, late-payment / NSF rate, and stable-employment percentage? A property-management company in the area should have these aggregated.
- How much new for-sale + rental construction is in the pipeline within 1–3 miles? Heavy new supply typically softens prices + rents 12–24 months out; constrained supply supports both.
Investment metrics
- 1% rule
- 0.82% ✗
- Cap rate
- 6.73%
- Cash-on-cash
- 1.56%
- DSCR
- 1.07
- GRM
- 10.2
CMA / ARV
- ARV (on-the-fly)
- $187,880
- Comps found
- 10
Show comp detail 10 sales within ~0.75 mi
| Address | Dist | Beds/Ba | Sqft | Sold | Price | $/sf | Match |
|---|---|---|---|---|---|---|---|
| 515 Elm Ave | 0.26mi | 2/1.0 | 892 (+4%) | 2mo | $123,000 | $138 | 75 |
| 914 Maple Ave | 0.31mi | 2/1.0 | 936 (+10%) | 8mo | $214,000 | $229 | 59 |
| 700 Nebraska Ave | 0.11mi | 3/1.0 (+1) | 795 (-7%) | 19mo | $161,300 | $203 | 58 |
| 1304 Prospect Ave | 0.41mi | 2/1.0 | 768 (-10%) | 3mo | $177,000 | $230 | 58 |
| 304 11th St | 0.44mi | 2/1.0 | 876 (+3%) | 19mo | $193,000 | $220 | 56 |
| 504 3rd St | 0.71mi | 2/2.0 | 860 (+1%) | 12mo | $181,000 | $210 | 55 |
| 1206 Hayes Ave | 0.59mi | 2/1.0 | 846 (-1%) | 16mo | $105,000 | $124 | 54 |
| 1002 7th St | 0.46mi | 2/1.0 | 768 (-10%) | 9mo | $156,000 | $203 | 50 |
| 303 13th Pl | 0.50mi | 3/1.0 (+1) | 768 (-10%) | 6mo | $189,900 | $247 | 46 |
| 1216 Taylor Ave | 0.67mi | 2/1.0 | 936 (+10%) | 14mo | $220,000 | $235 | 37 |
Match score weights: distance 35% · size 25% · config 20% · recency 20%. Top-matched comps best support the ARV.
Projected returns pro-forma
-3.0% appreciation · 3.31% rent growth · sell at horizon
- IRR
- -13.6%
- Equity multiple
- 0.51×
- Total profit
- $-21,175
- Equity at exit
- $23,096
- IRR
- -4.3%
- Equity multiple
- 0.71×
- Total profit
- $-12,423
- Equity at exit
- $13,393
Cash invested: $43,372 (down + closing). Projections, not guarantees.
Landlord ↔ Tenant lean methodology
- Overall (STATE)
- 83 Strongly Landlord-Friendly
- State Nebraska
- 83 Strongly Landlord-Friendly · R+13
- County
- — inherits STATE
- City
- — inherits STATE
ZIP-level market 68701
- Rents YoY
- 3.3%
- Active inventory
- 230
- Price-to-rent
- 10.2×
Monthly cashflow live
- Estimated rent
- $1,266 high interval (Pro) →
- Mortgage (P&I)
- −$812
- Tax from tax record
- −$67 /mo · $801/yr
- Insurance
- −$65
- HOA
- −$0
- Vacancy / Maint / Mgmt
- −$266
- Net cashflow
- $56
Break-even live
Sensitivity live
| Price | -10% $144 | -5% $100 | +0% $56 | +5% $12 | +10% $-31 |
|---|---|---|---|---|---|
| Rent | -10% $-44 | -5% $6 | +0% $56 | +5% $106 | +10% $156 |
| Rate | -1.0pp $134 | -0.5pp $96 | base $56 | +0.5pp $16 | +1.0pp $-25 |
UW: 25.0% down · 7.5% · 30yr · 1.5% tax · 5.0% vac · 8.0% maint · 8.0% mgmt
Financing live
Cash to close
- Down payment
- $38,725
- Closing costs
- $4,647
- Reserves months
- —
- Total cash needed
- —
Loan-product check · same deal, 3 products live
Conventional
25% down · 7.5% · 30yr
- Down + closing
- —
- Monthly P&I
- —
- Monthly cashflow
- —
- DSCR
- —
- Eligible?
- —
Personal DTI + credit; lowest rate.
DSCR
20% down · 8.5% · 30yr
- Down + closing
- —
- Monthly P&I
- —
- Monthly cashflow
- —
- DSCR
- —
- Eligible?
- —
No personal income docs; deal must DSCR.
Hard money
10% down · 12.0% · 12mo
- Down + closing
- —
- Monthly P&I
- —
- Monthly cashflow
- —
- DSCR
- —
- Eligible?
- —
Short-term bridge; refi at stabilization.
Rent comps 14 comps
| Address | Beds | Baths | Sqft | Rent | $/sqft | DOM | Units | Dist |
|---|---|---|---|---|---|---|---|---|
| 1401 Lakewood Dr Norfolk, NE | 2.0–3.0 | 1.0–1.5 | 937 | $1,120 | $1.19 | 25d | 2 | 0.86mi |
| 107 Gold Strike Dr Norfolk, NE | 2.0 | 1.0 | 675 | $1,095 | $1.62 | 45d | 1 | 0.89mi |
| 110 Gold Strike Dr Norfolk, NE | 2.0 | 1.0 | 615 | $1,095 | $1.78 | 45d | 1 | 0.89mi |
| 901 Syracuse Ave Norfolk, NE | 2.0 | 1.0 | 1000 | $1,095 | $1.09 | 45d | 1 | 0.95mi |
| 1805 Parker Cir Norfolk, NE | 2.0 | 1.0 | 700 | $1,095 | $1.56 | 45d | 1 | 1.12mi |
| 1303 Galeta Ave Norfolk, NE | 2.0 | 1.0 | 900 | $1,270 | $1.41 | 21d | 1 | 1.17mi |
| 721 Legacy Dr Unit 13 Norfolk, NE | 1.0 | 1.0 | 642 | $1,225 | $1.91 | 45d | 1 | 1.28mi |
| 715 Legacy Dr Unit 16 Norfolk, NE | 2.0 | 2.0 | 989 | $1,545 | $1.56 | 45d | 1 | 1.30mi |
| 703 Legacy Dr Norfolk, NE | 1.0 | 1.0 | 644 | $1,172 | $1.82 | 45d | 2 | 1.35mi |
| 1007 Sunrise Dr Unit 5 Norfolk, NE | 1.0 | 1.0 | 692 | $1,275 | $1.84 | 23d | 1 | 1.38mi |
| 1015 Sunrise Dr Unit 15 Norfolk, NE | 2.0 | 2.0 | 960 | $1,449 | $1.51 | 16d | 1 | 1.41mi |
| 1015 Sunrise Dr Norfolk, NE | 1.0–2.0 | 1.0–2.0 | 815 | $1,495 | $1.83 | 45d | 2 | 1.41mi |
| 1015 Sunrise Dr Unit 20 Norfolk, NE | 2.0 | 2.0 | 989 | $1,495 | $1.51 | 45d | 1 | 1.41mi |
| 1101 Sunrise Dr Norfolk, NE | 1.0–2.0 | 1.0–2.0 | 784 | $1,699 | $2.17 | 25d | 30 | 1.44mi |
Listing history 14 events
-
2026-06-19days on market $154,900 Active 18 DOM
-
2026-06-18days on market $154,900 Active 17 DOM
-
2026-06-17days on market $154,900 Active 16 DOM
-
2026-06-16days on market $154,900 Active 15 DOM
-
2026-06-15days on market $154,900 Active 14 DOM
-
2026-06-14days on market $154,900 Active 12 DOM
-
2026-06-12days on market $154,900 Active 11 DOM
-
2026-06-09days on market $154,900 Active 8 DOM
-
2026-06-08days on market $154,900 Active 7 DOM
-
2026-06-07days on market $154,900 Active 6 DOM
-
2026-06-05days on market $154,900 Active 3 DOM
-
2026-06-03days on market $154,900 Active 2 DOM
-
2026-06-01remarks 534-char remark
-
2026-06-01$154,900 Active 1 DOM
ⓘ Source: listings_history table (triggers on properties + properties_extension) + one-shot
backfill from property_details.listing_events for pre-trigger history.
Tax reassessment forecast NE · Resets to sale price
- Current annual tax
- $801 · $67/mo
- Projected year-2 tax
- $2,680 · $223/mo
- Expected delta
- +$1,879/yr (+$157/mo · 234.7%)
ⓘ Screening estimate from a state-policy table — verify with the county assessor before closing.
Climate risk First Street
- Flood 1/10 Low FEMA zone X (unshaded) · 0% chance over 30 yrs
- Wildfire 1/10 Low
- Heat 3/10 Moderate 7 d/yr ≥102°F today · 15 d/yr by 30 yrs out
- Wind 2/10 Low
- Air quality 2/10 Low 1 unhealthy d/yr today · 1 by 30 yrs out
Nearby sold comps map
Loading sold comps map…
Walkable amenities ~0.75 mi
Loading nearby amenities…
Taxation est. · year 1
- Rental income
- $15,189
- − Mortgage interest
- −$8,677
- − Property taxes
- −$801
- − Insurance
- −$774
- − Repairs & maintenance
- −$1,215
- − Management
- −$1,215
- − Depreciation
- −$4,506
- Taxable loss
- −$2,000
- Est. tax savings @ 24.0%
- +$480
- After-tax cash flow
- $1,156/yr
For passive investors: Depreciation is non-cash, so a rental often shows a tax loss while cash-flowing — sheltering income. Rental losses are passive: they offset passive income freely, and up to $25,000/yr can offset ordinary (W-2) income if you actively participate and your MAGI is under $100k (phasing out to $0 by $150k); unused losses carry forward. On sale, claimed depreciation is recaptured at up to 25%, and gains may owe capital-gains tax (a 1031 exchange can defer both). Figures are a year-1 estimate at your 24.0% rate — not tax advice; consult a CPA.
Schools (NCES district)
- District
- Norfolk Public Schools
- NCES district ID
- 3174430
- Math proficiency
- 44% ▼ -7.00%
- Reading proficiency
- 46% ▼ -7.00%
- Median HH income
- $46,579
- Composite
- 38.31/100
- National rank
- #4227
- State rank
- #84 of 111 in NE
Livability — Norfolk
- Score
- 78/100
- State rank
- #54
- US rank
- #2611
Category grades
Schools grade is shown separately in the Schools card above.
Census & demographics
- Census place
- Norfolk, NE
- County
- Madison County · 31,417 people
- City population
- 31,417
- Metro
- Norfolk, NE
- Population (ZIP)
- 31,417
- Household income
- $62,633
- Rent vs Own
- Severe rent burden
- 861.0
Population outlook (Madison County) Hauer SSP2
- Today (2025)
- 35,536 people
- By 2030
- 35,518 · -0.1%
- By 2040
- 35,170 · -1.0%
- By 2050
- 34,606 · -2.6%
- By 2075
- 34,522 · -2.9%
- By 2100
- 34,307 · -3.5%
Race, ethnicity, and origin ACS 2023
- Neighborhood character
- Predominantly White (80%)
- Race & ethnicity
- White 80% Hispanic / Latino 14% Two or more races 9% Native American 1% Black 1%
- Hispanic origin (detail)
- Mexican 11% Cuban 1%
- Common ancestry
- Portuguese 2% Romanian 1% Lithuanian 1%
- Foreign-born
- 6% · Canada
- Languages at home
- 90% English-only · Spanish 9%
Political lean MEDSL · Madison
- 2024 margin
- Solid R (+56.0) · D 21.4% · R 77.4% · Other 1.2%
- 2008→2024 swing
- -16.8pp toward R · 2008: -39.2pp · 2024: -56.0pp
- All cycles
- 2024: R+56.0 2020: R+53.5 2016: R+56.3 2012: R+48.1 2008: R+39.2
Not yet ingested
- Civics
- —
Market trends
- HPI YoY
- ▼ -172.61%
- Current HPI
- 260.5574
- Rent YoY
- ▲ 3.31%
- Metro
- Norfolk, NE
- State GDP YoY
- ▲ 0.68%
- F500 in state
- 2
Industry mix (Fortune 500 HQ in NE)
| Industry | F500 HQs | Revenue |
|---|---|---|
| Conglomerate | 1 | $371B |
|
||
Price history
1 event — show timeline
- 2026-06-01 Listed $154,900 NNEMLS
Property tax history
-0.5%/yrLatest (2025): $801 · +4.9% YoY. Source: county tax records.
Cash-flow waterfall
monthlySold comps — $/sqft
last 12 mo · ≤1 miLoading sold comps…