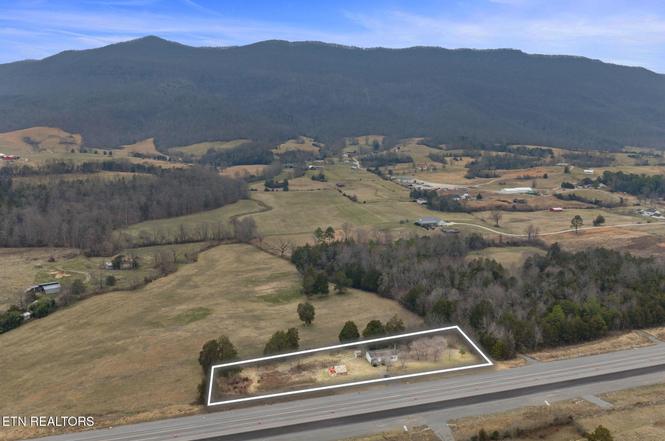
6555 General Carl W Stiner Hwy
Fincastle, TN 37766
$139,900D
3 bd · 2.0 ba ·
1,188 sqft ·
Built 2006
· Manufactured
· Active
· 113 DOM
Cashflow @ list (25.0% down · 7.5%)
Estimated rent
$1,084/mo
Mortgage (P&I)
−$734
Tax + insurance
−$233
HOA
−$0
Vac / Maint / Mgmt
−$228
Net cashflow
$-110/mo
Annual
$-1,324/yr
Cap rate
5.35%
Cash-on-cash
-3.38%
DSCR
0.85
1% rule
0.77%
Cash to close
$39,172
Investor read
- This is a 3-bed/2.0-bath manufactured listed at $140k.
- At list price, monthly cash flow is $-110 ($-1k/yr) — negative.
- To cash-flow at today's rent, offer at most $124k (11.4% below list).
- To meet the 1% rule (rent ≥ 1% of price), the offer needs to be $108k (22.5% below list).
- It's been on market 113 days — a 9% lower offer ($127k) is reasonable based on typical stale-listing flexibility.
- Recommended offer: $108k (22.5% below list) — sets the bar for 1% rule.
- In year one you build about $15k of equity ($967 loan paydown + $14k appreciation (10.0% local appreciation)).
- Location reads 57/100 on livability (#320 in TN) — a working-class tenant base; expect higher turnover. Strengths: cost of living A+, housing A, crime B; Watch: amenities F, commute F, employment F.
- Campbell County (rural): math 19% / reading 20% proficiency, ranked #120 of 139 in TN (top 86%) — low school quality limits family demand, transient renter base, plan for 1-2y turnover; 64% free/reduced lunch — lower-income household profile, screen leases tightly.
- Zoned schools: Jacksboro Elementary (math 43% / reading 31%, grade F, #272 of 952 statewide, top 31%, 650 students, 0% FRL); Jacksboro Middle School (math 28% / reading 23%, grade F, #147 of 333 statewide, top 45%, 493 students, 0% FRL); Campbell County Comprehensive High School (math 12% / reading 24%, grade F, #212 of 332 statewide, top 64%, 1,242 students, 0% FRL) — zoned schools average 0% FRL vs 64% district-wide (64 pts lower); this property's tenant base skews higher-income than the district average.
- Market conditions: 280 active listings in the ZIP; 111 units permitted in Campbell County in 2024 (0 in 5+ unit buildings).
- Campbell County population projected at -21% by 2050 — secular population decline; favor cash flow + early exit over multi-decade hold.
- By year 3, paydown + projected appreciation supports a ~$38k cash-out refi (75% LTV) — recoverable capital for the next deal without selling this one.
- Climate carrying-cost: extreme-heat days projected 8→21/yr by 2055 (HVAC capex compounding) — expect insurance premiums to compound above CPI over the hold.
- Cap rate 5.3% vs local median 0.5% in Fincastle — top-decile yield for the area; either an underpriced asset or a hidden risk that comps aren't pricing in. Stress-test before assuming the spread holds.
Questions for listing agent
- What do current leases actually rent for vs. the listed asking? Can we see a recent rent roll and the last 12 months of T-12 income?
- It's been on market 113 days. Have you received any prior offers? Is the seller open to a 23% concession, seller financing, or rate buy-down credit?
- Why hasn't it sold? Are there any deal-killer items the seller is aware of (foundation, flood, title, zoning, code violations)?
- Is there a deadline driving the sale (1031 exchange, divorce, estate, relocation)? That informs how much negotiation room exists.
- Schools are F-rated, which usually means shorter tenancies and higher turnover. Who's the typical renter profile here, and what's been the actual vacancy rate?
- The area grade is low — what's the realistic commute time and amenity access for the typical tenant pool here? Any planned neighborhood developments (good or bad) we should know about?
- What's the average days-on-market for RENTAL listings here right now (not sales)? A rising rental-DOM trend means longer vacancies and softer asking-rent achievability than the comps imply.
- What's the recent tenant-quality profile in this submarket — average credit score on applications, eviction rate, late-payment / NSF rate, and stable-employment percentage? A property-management company in the area should have these aggregated.
CashFlowRE · CFR-HPHAWNEE5H344G
· Data 1 day ago
cashflowre.app · 2026-05-29