6555 General Carl W Stiner Hwy · Fincastle, TN
Flood risk 1/10 · Minimal
- FEMA flood zone
- X
- Chance of flooding over 30 yrs
- 0.0%
- Est. flood insurance / yr
- $507 – $1,088
Fire risk 4/10 · Minor
- Est. fire insurance / yr
- $949 – $1,763
Heat risk 5/10 · Moderate
- Hot days now (above 102°F)
- 8 days/yr
- Hot days in 30 yrs
- 21 days/yr
Wind risk 3/10 · Minor
- Chance of severe wind over 30 yrs
- 5.0%
Air-quality risk 3/10 · Minor
- Unhealthy air days now
- 3 days/yr
- Unhealthy air days in 30 yrs
- 3 days/yr
Risk factors via First Street. Map © Google.
Why this score? — see what drove the D grade
The composite is a weighted blend of 9 inputs, each scored 0–100. Each bar is that input's sub-score; the figure is the points it added to the 100-point composite (weight × sub-score).
- Appreciation +10.0/10.0
- Cash flow +9.0/30.0
- ARV discount +7.5/15.0
- Livability +2.9/5.0
- 1% rule +2.7/10.0
- DSCR +2.5/10.0
- Rent growth +2.5/5.0
- Condition / age +2.5/5.0
- Schools +1.6/10.0
$139,900
🖨 Deal sheet (PDF) 📄 Offer letter ✓ Due diligence
Listing remarks
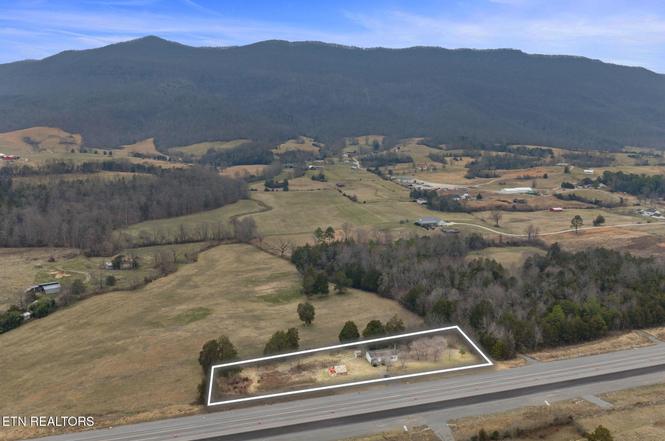
Investment Opportunity on 1.5 Acres - 6555 General Carl Steiner Highway, LaFollette, TN 37766 - Campbell County Tennessee Located along General Carl Steiner Highway in LaFollette, Tennessee, this 1.5-acre level and mostly cleared property presents a rare opportunity in a high-visibility corridor of Campbell County. With over 400 feet of road frontage, the possibilities for residential use, rental income, or potential redevelopment are significant. The property includes a 2006 mobile home offering just under 1,200 square feet with a functional split-bedroom layout. The home features two bathrooms and an open-concept kitchen, dining, and living room area. While the home does require work a
Key facts
- 2006 mobile home
- Open-concept kitchen
- 12 x 24 barn
Tags
Property features AI
Exterior
- Parking: Off-street parking
- Utilities: Septic tank
- Home design: Detached property
- Construction: Vinyl siding; Frame construction; Approximately 1,188 building area (per tax records)
- Exterior features: Storage building; Workshop; Irregular lot with rolling slope; Country setting views
Interior
- Kitchen: Eat-in layout
- Bathrooms: 2 full bathrooms
- Heating & cooling: Electric heating; No central cooling
- Interior features: Eat-in kitchen; 6 total rooms
Neighborhood map
What this means for you Summary
Snapshot
- This is a 3-bed/2.0-bath manufactured listed at $140k.
Deal economics
- At list price, monthly cash flow is $-110 ($-1k/yr) — negative.
- To cash-flow at today's rent, offer at most $124k (11.4% below list).
- To meet the 1% rule (rent ≥ 1% of price), the offer needs to be $108k (22.5% below list).
- Recommended offer: $108k (22.5% below list) — sets the bar for 1% rule.
- Cap rate 5.3% vs local median 0.5% in Fincastle — top-decile yield for the area; either an underpriced asset or a hidden risk that comps aren't pricing in. Stress-test before assuming the spread holds.
Location & tenants
- Location reads 57/100 on livability (#320 in TN) — a working-class tenant base; expect higher turnover. Strengths: cost of living A+, housing A, crime B; Watch: amenities F, commute F, employment F.
- Campbell County (rural): math 19% / reading 20% proficiency, ranked #120 of 139 in TN (top 86%) — low school quality limits family demand, transient renter base, plan for 1-2y turnover; 64% free/reduced lunch — lower-income household profile, screen leases tightly.
- Zoned schools: Jacksboro Elementary (math 43% / reading 31%, grade F, #272 of 952 statewide, top 31%, 650 students, 0% FRL); Jacksboro Middle School (math 28% / reading 23%, grade F, #147 of 333 statewide, top 45%, 493 students, 0% FRL); Campbell County Comprehensive High School (math 12% / reading 24%, grade F, #212 of 332 statewide, top 64%, 1,242 students, 0% FRL) — zoned schools average 0% FRL vs 64% district-wide (64 pts lower); this property's tenant base skews higher-income than the district average.
- Market conditions: 280 active listings in the ZIP; 111 units permitted in Campbell County in 2024 (0 in 5+ unit buildings).
Forward outlook
- In year one you build about $15k of equity ($967 loan paydown + $14k appreciation (10.0% local appreciation)).
- Campbell County population projected at -21% by 2050 — secular population decline; favor cash flow + early exit over multi-decade hold.
- By year 3, paydown + projected appreciation supports a ~$38k cash-out refi (75% LTV) — recoverable capital for the next deal without selling this one.
Negotiation context
- It's been on market 113 days — a 9% lower offer ($127k) is reasonable based on typical stale-listing flexibility.
Risks & watch-outs
- Climate carrying-cost: extreme-heat days projected 8→21/yr by 2055 (HVAC capex compounding) — expect insurance premiums to compound above CPI over the hold.
Questions for the listing agent
- What do current leases actually rent for vs. the listed asking? Can we see a recent rent roll and the last 12 months of T-12 income?
- It's been on market 113 days. Have you received any prior offers? Is the seller open to a 23% concession, seller financing, or rate buy-down credit?
- Why hasn't it sold? Are there any deal-killer items the seller is aware of (foundation, flood, title, zoning, code violations)?
- Is there a deadline driving the sale (1031 exchange, divorce, estate, relocation)? That informs how much negotiation room exists.
- Schools are F-rated, which usually means shorter tenancies and higher turnover. Who's the typical renter profile here, and what's been the actual vacancy rate?
- The area grade is low — what's the realistic commute time and amenity access for the typical tenant pool here? Any planned neighborhood developments (good or bad) we should know about?
- What's the average days-on-market for RENTAL listings here right now (not sales)? A rising rental-DOM trend means longer vacancies and softer asking-rent achievability than the comps imply.
- What's the recent tenant-quality profile in this submarket — average credit score on applications, eviction rate, late-payment / NSF rate, and stable-employment percentage? A property-management company in the area should have these aggregated.
- How much new for-sale + rental construction is in the pipeline within 1–3 miles? Heavy new supply typically softens prices + rents 12–24 months out; constrained supply supports both.
Investment metrics
- 1% rule
- 0.77% ✗
- Cap rate
- 5.35%
- Cash-on-cash
- -3.38%
- DSCR
- 0.85
- GRM
- 10.8
CMA / ARV
No comps found within radius.
Projected returns pro-forma
10.0% appreciation · 3.0% rent growth · sell at horizon
- IRR
- 21.9%
- Equity multiple
- 2.77×
- Total profit
- $69,183
- Equity at exit
- $126,033
- IRR
- 19.7%
- Equity multiple
- 6.34×
- Total profit
- $209,290
- Equity at exit
- $271,795
Cash invested: $39,172 (down + closing). Projections, not guarantees.
Landlord ↔ Tenant lean methodology
- Overall (STATE)
- 87 Strongly Landlord-Friendly
- State Tennessee
- 87 Strongly Landlord-Friendly · R+13
- County
- — inherits STATE
- City
- — inherits STATE
ZIP-level market 37766
- Home prices YoY
- 4.4%
- Active inventory
- 280
- Price-to-rent
- 10.8×
Monthly cashflow live
- Estimated rent
- $1,084 medium interval (Pro) →
- Mortgage (P&I)
- −$734
- Tax est. 1.5%
- −$175 /mo · $2,098/yr
- Insurance
- −$58
- HOA
- −$0
- Vacancy / Maint / Mgmt
- −$228
- Net cashflow
- $-110
Break-even live
Sensitivity live
| Price | -10% $-14 | -5% $-62 | +0% $-110 | +5% $-159 | +10% $-207 |
|---|---|---|---|---|---|
| Rent | -10% $-196 | -5% $-153 | +0% $-110 | +5% $-68 | +10% $-25 |
| Rate | -1.0pp $-40 | -0.5pp $-75 | base $-110 | +0.5pp $-147 | +1.0pp $-183 |
UW: 25.0% down · 7.5% · 30yr · 1.5% tax · 5.0% vac · 8.0% maint · 8.0% mgmt
Financing live
Cash to close
- Down payment
- $34,975
- Closing costs
- $4,197
- Reserves months
- —
- Total cash needed
- —
Loan-product check · same deal, 3 products live
Conventional
25% down · 7.5% · 30yr
- Down + closing
- —
- Monthly P&I
- —
- Monthly cashflow
- —
- DSCR
- —
- Eligible?
- —
Personal DTI + credit; lowest rate.
DSCR
20% down · 8.5% · 30yr
- Down + closing
- —
- Monthly P&I
- —
- Monthly cashflow
- —
- DSCR
- —
- Eligible?
- —
No personal income docs; deal must DSCR.
Hard money
10% down · 12.0% · 12mo
- Down + closing
- —
- Monthly P&I
- —
- Monthly cashflow
- —
- DSCR
- —
- Eligible?
- —
Short-term bridge; refi at stabilization.
Listing history 17 events
-
2026-06-21days on market $139,900 Active 113 DOM
-
2026-06-18days on market $139,900 Active 111 DOM
-
2026-06-17days on market $139,900 Active 110 DOM
-
2026-06-16days on market $139,900 Active 109 DOM
-
2026-06-15days on market $139,900 Active 108 DOM
-
2026-06-13days on market $139,900 Active 106 DOM
-
2026-06-12days on market $139,900 Active 105 DOM
-
2026-06-09days on market $139,900 Active 102 DOM
-
2026-06-08days on market $139,900 Active 101 DOM
-
2026-06-08days on market $139,900 Active 100 DOM
-
2026-06-07days on market $139,900 Active 99 DOM
-
2026-06-04days on market $139,900 Active 96 DOM
-
2026-06-02days on market $139,900 Active 95 DOM
-
2026-06-01days on market $139,900 Active 94 DOM
-
2026-05-31days on market $139,900 Active 93 DOM
-
2026-05-01price $139,900
-
2026-02-27$144,900 Active
ⓘ Source: listings_history table (triggers on properties + properties_extension) + one-shot
backfill from property_details.listing_events for pre-trigger history.
Climate risk First Street
- Flood 1/10 Low FEMA zone X · 0% chance over 30 yrs
- Wildfire 4/10 Moderate
- Heat 5/10 Major 8 d/yr ≥102°F today · 21 d/yr by 30 yrs out
- Wind 3/10 Moderate 5% chance of damaging wind over 30 yrs
- Air quality 3/10 Moderate 3 unhealthy d/yr today · 3 by 30 yrs out
Nearby sold comps map
Loading sold comps map…
Walkable amenities ~0.75 mi
Loading nearby amenities…
Taxation est. · year 1
- Rental income
- $13,010
- − Mortgage interest
- −$7,837
- − Property taxes
- −$2,098
- − Insurance
- −$700
- − Repairs & maintenance
- −$1,041
- − Management
- −$1,041
- − Depreciation
- −$4,070
- Taxable loss
- −$3,776
- Est. tax savings @ 24.0%
- +$906
- After-tax cash flow
- $-418/yr
For passive investors: Depreciation is non-cash, so a rental often shows a tax loss while cash-flowing — sheltering income. Rental losses are passive: they offset passive income freely, and up to $25,000/yr can offset ordinary (W-2) income if you actively participate and your MAGI is under $100k (phasing out to $0 by $150k); unused losses carry forward. On sale, claimed depreciation is recaptured at up to 25%, and gains may owe capital-gains tax (a 1031 exchange can defer both). Figures are a year-1 estimate at your 24.0% rate — not tax advice; consult a CPA.
Schools (NCES district)
- District
- Campbell County
- NCES district ID
- 4700420
- Math proficiency
- 19% ▼ -9.00%
- Reading proficiency
- 20% ▼ -6.00%
- Median HH income
- $32,606
- Composite
- 15.84/100
- National rank
- #9262
- State rank
- #120 of 139 in TN
Livability — Fincastle
- Score
- 57/100
- State rank
- #320
- US rank
- #21613
Category grades
Schools grade is shown separately in the Schools card above.
Census & demographics
- Population (ZIP)
- 17,643
Population outlook (Campbell County) Hauer SSP2
- Today (2025)
- 37,507 people
- By 2030
- 35,989 · -4.0%
- By 2040
- 32,773 · -12.6%
- By 2050
- 29,475 · -21.4%
- By 2075
- 21,972 · -41.4%
- By 2100
- 15,332 · -59.1%
Race, ethnicity, and origin ACS 2023
- Neighborhood character
- Predominantly White (95%)
- Race & ethnicity
- White 95% Two or more races 3% Hispanic / Latino 3%
- Common ancestry
- Slovak 4% Lithuanian 2% Serbian 1%
- Foreign-born
- 1% · Canada
- Languages at home
- 99% English-only · Spanish 1%
Political lean MEDSL · Campbell
- 2024 margin
- Solid R (+69.6) · D 14.8% · R 84.5%
- 2008→2024 swing
- -32.7pp toward R · 2008: -37.0pp · 2024: -69.6pp
- All cycles
- 2024: R+69.6 2020: R+66.2 2016: R+60.9 2012: R+43.6 2008: R+37.0
Not yet ingested
- Civics
- —
Market trends
- HPI YoY
- ▲ 15.90%
- Current HPI
- 378.2421
- Rent YoY
- —
- Metro
- —
- State GDP YoY
- ▲ 2.78%
- F500 in state
- 22
Industry mix (Fortune 500 HQ in TN)
| Industry | F500 HQs | Revenue |
|---|---|---|
| Healthcare | 3 | $91B |
|
||
| Retail | 3 | $72B |
|
||
| Transportation / Logistics | 1 | $88B |
|
||
| Paper / Packaging | 1 | $19B |
|
||
| Insurance | 1 | $13B |
|
||
| Energy | 1 | $12B |
|
||
Price history
-3.5% since first listed2 events — show timeline
- 2026-05-01 Price Changed $139,900 Knoxville MLS
- 2026-02-27 Listed $144,900 Knoxville MLS
Cash-flow waterfall
monthlySold comps — $/sqft
last 12 mo · ≤1 miLoading sold comps…