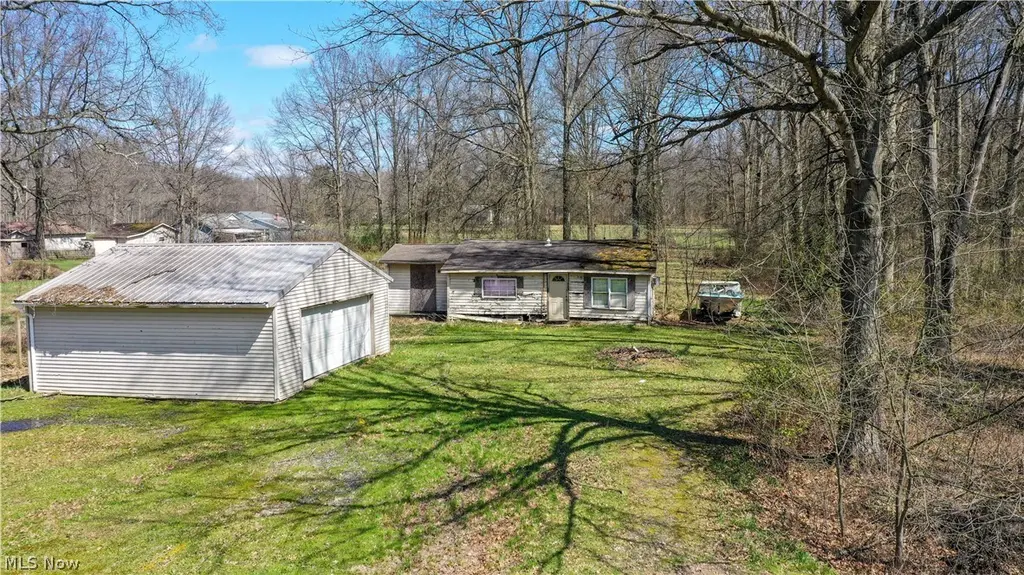
5556 Shaffer Rd NW
Champion Heights, OH 44481
$42,900A-
1 bd · 1.0 ba ·
864 sqft ·
Built 1930
· SingleFamily
· Active
· 71 DOM
Cashflow @ list (25.0% down · 7.5%)
Estimated rent
$849/mo
Mortgage (P&I)
−$225
Tax + insurance
−$65
HOA
−$0
Vac / Maint / Mgmt
−$178
Net cashflow
$381/mo
Annual
$4,574/yr
Cap rate
16.95%
Cash-on-cash
38.08%
DSCR
2.69
1% rule
1.98%
Cash to close
$12,012
Investor read
- This is a 1-bed/1.0-bath single-family listed at $43k.
- At list price, monthly cash flow is $381 ($5k/yr) — positive.
- The deal already cash-flows at list — no discount required.
- Meets the 1% rule at list price ($849 rent vs $43k).
- It's been on market 71 days — a 6% lower offer ($40k) is reasonable based on typical stale-listing flexibility.
- Recommended offer: $40k (6.0% below list) — sets the bar for market timing.
- In year one you build about $5k of equity ($297 loan paydown + $4k appreciation (10.0% local appreciation)).
- Location reads 68/100 on livability (#569 in OH) — a middle-class / working-renter tenant base. Strengths: cost of living A+, housing A+, crime B; Watch: employment C-, schools D+, amenities F.
- Champion Local (suburban): math 70% / reading 74% proficiency, ranked #131 of 656 in OH (top 20%) — strong family-tenant draw, lease renewals of 3-5y typical.
- Watch-outs: built in 1930 — expect roof / HVAC / electrical / plumbing capex.
- Market conditions: 37 active listings in the ZIP; 129 units permitted in Trumbull County in 2024 (0 in 5+ unit buildings).
- Trumbull County population projected at -22% by 2050 — secular population decline; favor cash flow + early exit over multi-decade hold.
- Current owner paid $25k; list at $43k implies a 72% gain — meaningful room to come down on a strong offer.
- At projected returns (10.0% appreciation + 3.0% rent growth), your $12k cash investment doubles in ~2 years — after that, you're playing with house money.
- By year 7, paydown + projected appreciation supports a ~$33k cash-out refi (75% LTV) — recoverable capital for the next deal without selling this one.
- Climate carrying-cost: major flood risk — expect insurance premiums to compound above CPI over the hold.
- Cap rate 17.0% vs local median 2.9% in Champion Heights — top-decile yield for the area; either an underpriced asset or a hidden risk that comps aren't pricing in. Stress-test before assuming the spread holds.
- This rent is only 16% of the median local income ($63k/yr) — well below the 30% rent-burden line; pricing power to push rent on renewal without tenant pushback.
Questions for listing agent
- It's been on market 71 days. Have you received any prior offers? Is the seller open to a 6% concession, seller financing, or rate buy-down credit?
- Built in 1930 — when were the roof, HVAC, electrical panel, plumbing, and water heater last replaced?
- Why hasn't it sold? Are there any deal-killer items the seller is aware of (foundation, flood, title, zoning, code violations)?
- Is there a deadline driving the sale (1031 exchange, divorce, estate, relocation)? That informs how much negotiation room exists.
- Schools are D-rated, which usually means shorter tenancies and higher turnover. Who's the typical renter profile here, and what's been the actual vacancy rate?
- What's the average days-on-market for RENTAL listings here right now (not sales)? A rising rental-DOM trend means longer vacancies and softer asking-rent achievability than the comps imply.
- What's the recent tenant-quality profile in this submarket — average credit score on applications, eviction rate, late-payment / NSF rate, and stable-employment percentage? A property-management company in the area should have these aggregated.
- How much new for-sale + rental construction is in the pipeline within 1–3 miles? Heavy new supply typically softens prices + rents 12–24 months out; constrained supply supports both.
CashFlowRE · CFR-HPZEEJ7M7MC229
· Data 1 day ago
cashflowre.app · 2026-05-29