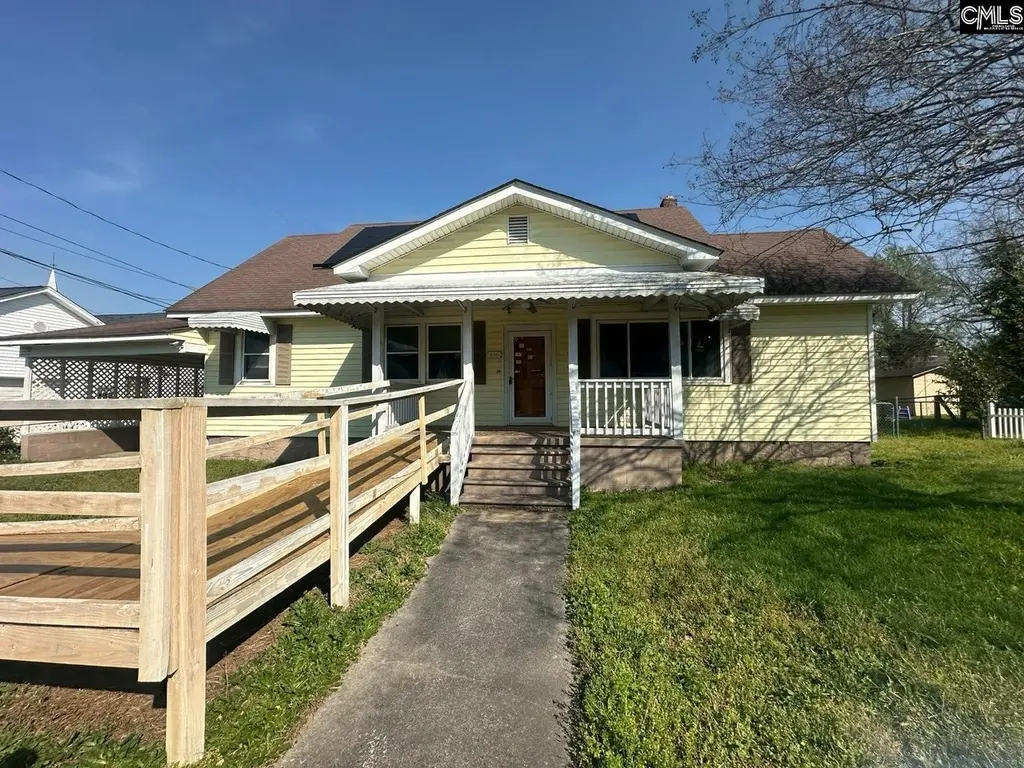
445 Oak Street St
Winnsboro, SC 29180
$89,900B-
4 bd · 2.0 ba ·
1,643 sqft ·
Built 1955
· SingleFamily
· Active
· 13 DOM
Cashflow @ list (25.0% down · 7.5%)
Estimated rent
$1,550/mo
Mortgage (P&I)
−$471
Tax + insurance
−$150
HOA
−$0
Vac / Maint / Mgmt
−$326
Net cashflow
$603/mo
Annual
$7,241/yr
Cap rate
14.35%
Cash-on-cash
28.77%
DSCR
2.28
1% rule
1.72%
Cash to close
$25,172
Investor read
- This is a 4-bed/2.0-bath single-family listed at $90k.
- At list price, monthly cash flow is $603 ($7k/yr) — positive.
- The deal already cash-flows at list — no discount required.
- Meets the 1% rule at list price ($2k rent vs $90k).
- Only 13 days on market — expect competitive offers; lowballing is unlikely to land.
- Local home prices are declining (-3.0%/yr); year-one equity from $622 of loan paydown is wiped out by about $3k of value loss. Plan a longer hold.
- Location reads 54/100 on livability (#320 in SC) — a working-class tenant base; expect higher turnover. Strengths: cost of living A+; Watch: housing D, amenities F, commute F.
- Fairfield 01 (rural): math 26% / reading 38% proficiency, ranked #53 of 80 in SC (top 66%) — families likely to look elsewhere, expect single-tenant / working-renter base with shorter leases; 80% free/reduced lunch — lower-income household profile, screen leases tightly.
- Zoned schools: Fairfield Elementary (math 16% / reading 17%, grade F, #535 of 597 statewide, top 90%, 463 students, 100% FRL); Fairfield Middle (math 17% / reading 29%, grade F, #171 of 229 statewide, top 76%, 337 students, 100% FRL); Fairfield Central High (math 37% / reading 77%, grade C, #120 of 196 statewide, top 64%, 662 students, 100% FRL) — zoned schools average 100% FRL vs 80% district-wide (20 pts higher); higher-poverty schools than district average — tighter screening recommended.
- Watch-outs: built in 1955 — expect roof / HVAC / electrical / plumbing capex.
- Market conditions: 76 active listings in the ZIP; lower-income renter base — watch delinquency; 91 units permitted in Fairfield County in 2024 (0 in 5+ unit buildings).
- Fairfield County population projected at -32% by 2050 — secular population decline; favor cash flow + early exit over multi-decade hold.
- Current owner paid $69k; 30% above their basis — modest negotiation headroom, anchor on the comps not their cost.
- At projected returns (-3.0% appreciation + 3.0% rent growth), your $25k cash investment doubles in ~5 years — after that, you're playing with house money.
- Climate carrying-cost: major wind risk, 54% chance of damaging wind over 30y; extreme-heat days projected 7→17/yr by 2055 (HVAC capex compounding) — expect insurance premiums to compound above CPI over the hold.
- This rent runs 43% of the median local income ($43k/yr) — at the standard rent-burdened threshold; future hikes will face affordability resistance.
Questions for listing agent
- Built in 1955 — when were the roof, HVAC, electrical panel, plumbing, and water heater last replaced?
- Is there a deadline driving the sale (1031 exchange, divorce, estate, relocation)? That informs how much negotiation room exists.
- Schools are F-rated, which usually means shorter tenancies and higher turnover. Who's the typical renter profile here, and what's been the actual vacancy rate?
- What's the average days-on-market for RENTAL listings here right now (not sales)? A rising rental-DOM trend means longer vacancies and softer asking-rent achievability than the comps imply.
- What's the recent tenant-quality profile in this submarket — average credit score on applications, eviction rate, late-payment / NSF rate, and stable-employment percentage? A property-management company in the area should have these aggregated.
- How much new for-sale + rental construction is in the pipeline within 1–3 miles? Heavy new supply typically softens prices + rents 12–24 months out; constrained supply supports both.
CashFlowRE · CFR-HQ12BYF4BXGBYV
· Data 16 h ago
cashflowre.app · 2026-05-29