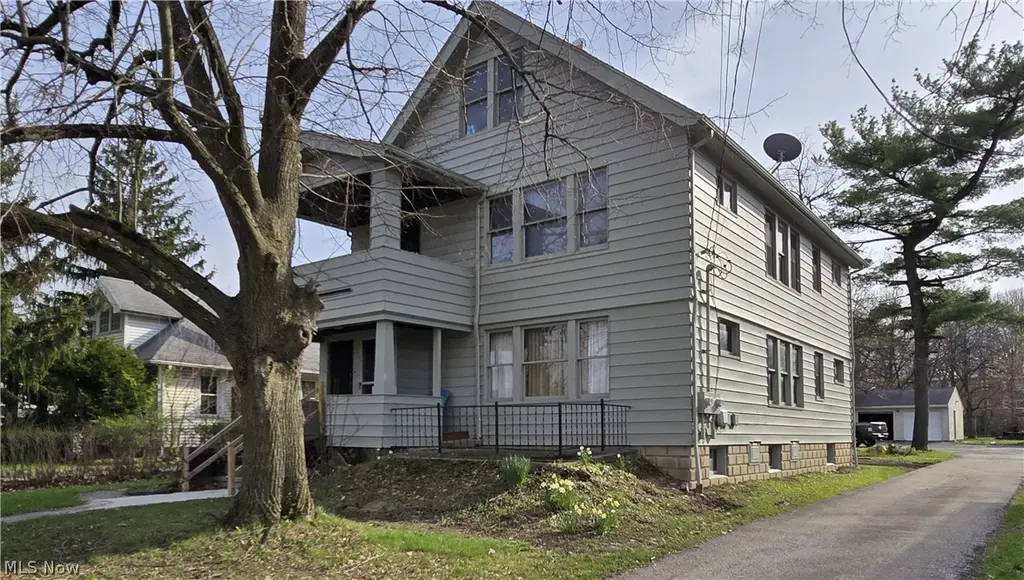
14512 Granger Rd
Maple Heights, OH 44137
$195,000B-
4 bd · 2.0 ba ·
2,184 sqft ·
Built 1930
· MultiFamily
· Pending
· 44 DOM
Cashflow @ list (25.0% down · 7.5%)
Estimated rent
$2,915/mo
Mortgage (P&I)
−$1,023
Tax + insurance
−$392
HOA
−$0
Vac / Maint / Mgmt
−$612
Net cashflow
$888/mo
Annual
$10,655/yr
Cap rate
11.76%
Cash-on-cash
19.51%
DSCR
1.87
1% rule
1.49%
Cash to close
$54,600
Investor read
- This is a 2 × 2-bed/1.0-bath units multifamily listed at $195k.
- At list price, monthly cash flow is $888 ($11k/yr) — positive. Per door: $444/mo.
- The deal already cash-flows at list — no discount required.
- Meets the 1% rule at list price ($3k rent vs $195k).
- It's been on market 44 days — a 3% lower offer ($189k) is reasonable based on typical stale-listing flexibility.
- Recommended offer: $189k (3.0% below list) — sets the bar for market timing.
- Local home prices are declining (-3.0%/yr); year-one equity from $1k of loan paydown is wiped out by about $6k of value loss. Plan a longer hold.
- Location reads 70/100 on livability (#470 in OH) — a middle-class / working-renter tenant base. Strengths: cost of living A+, housing A, health & safety A-; Watch: schools D+, crime D, employment D.
- Maple Heights City (suburban): math 14% / reading 25% proficiency, ranked #630 of 656 in OH (top 96%) — low school quality limits family demand, transient renter base, plan for 1-2y turnover; 78% free/reduced lunch — lower-income household profile, screen leases tightly.
- Watch-outs: built in 1930 — expect roof / HVAC / electrical / plumbing capex.
- Market conditions: Rents rising fast (+14.8%/yr); 84 active listings in the ZIP; 11 comparable units currently listed for rent nearby; rentals at typical pace (median 17d on market — plan ~3-4 weeks tenant-placement turnaround); 1,441 units permitted in Cuyahoga County in 2024 (700 in 5+ unit buildings).
- Cuyahoga County population projected to shrink 8% by 2050 — rents likely to lag national; underwrite the cash flow, not the appreciation.
- 2 sale attempts; this cycle's ask has dropped $15k (7%) from the opening price — seller is motivated, your offer sets the floor, not the list.
- Current owner paid $108k; list at $195k implies a 81% gain — meaningful room to come down on a strong offer.
- At projected returns (-3.0% appreciation + 8.0% rent growth), your $55k cash investment doubles in ~5 years — after that, you're playing with house money.
- Cap rate 11.8% vs local median 7.7% in Maple Heights — top-decile yield for the area; either an underpriced asset or a hidden risk that comps aren't pricing in. Stress-test before assuming the spread holds.
- At $2,915/mo this rent would consume 65% of the median local household income ($54k/yr) (locally 971% of renters already pay >50% of income on rent) — very limited rent-growth headroom before tenants either downsize or default.
Questions for listing agent
- It's been on market 44 days. Have you received any prior offers? Is the seller open to a 3% concession, seller financing, or rate buy-down credit?
- Can we see the unit-by-unit rent roll, current vacancy, and any below-market leases? What's the average tenancy length?
- What capital expenditures (roof, boiler, parking lot, exteriors) have been made in the last 5 years, and what's planned in the next 2?
- Built in 1930 — when were the roof, HVAC, electrical panel, plumbing, and water heater last replaced?
- Is there a deadline driving the sale (1031 exchange, divorce, estate, relocation)? That informs how much negotiation room exists.
- Schools are D-rated, which usually means shorter tenancies and higher turnover. Who's the typical renter profile here, and what's been the actual vacancy rate?
- Crime grade is D in this area — have there been break-ins, vandalism, or insurance claims at this property in the last 3 years? What carrier currently insures it and at what premium?
- What's the average days-on-market for RENTAL listings here right now (not sales)? A rising rental-DOM trend means longer vacancies and softer asking-rent achievability than the comps imply.
CashFlowRE · CFR-HRNHX98PFMYX2N
· Data 2 weeks ago
cashflowre.app · 2026-05-29