2228 County Road 255
Fort Payne, AL 35967
$90,000C
3 bd · 2.0 ba ·
1,280 sqft ·
Built —
· Manufactured
· Contingent
· 13 DOM
Cashflow @ list (25.0% down · 7.5%)
Estimated rent
$1,077/mo
Mortgage (P&I)
−$472
Tax + insurance
−$150
HOA
−$0
Vac / Maint / Mgmt
−$226
Net cashflow
$229/mo
Annual
$2,750/yr
Cap rate
9.35%
Cash-on-cash
10.91%
DSCR
1.49
1% rule
1.20%
Cash to close
$25,200
Investor read
- This is a 3-bed/2.0-bath manufactured listed at $90k. Condition is rated poor.
- At list price, monthly cash flow is $229 ($3k/yr) — positive.
- The deal already cash-flows at list — no discount required.
- Meets the 1% rule at list price ($1k rent vs $90k).
- Only 13 days on market — expect competitive offers; lowballing is unlikely to land.
- Local home prices are declining (-3.0%/yr); year-one equity from $622 of loan paydown is wiped out by about $3k of value loss. Plan a longer hold.
- Location reads 67/100 on livability (#86 in AL) — a middle-class / working-renter tenant base. Strengths: cost of living A+, housing A+, health & safety A-; Watch: amenities F, commute F, employment F.
- Dekalb County (rural): math 18% / reading 37% proficiency, ranked #82 of 129 in AL (top 64%) — low school quality limits family demand, transient renter base, plan for 1-2y turnover.
- Zoned schools: Crossville Elementary School (math 17% / reading 27%, grade F, #442 of 627 statewide, top 72%, 578 students, 94% FRL); Crossville Middle School (math 8% / reading 20%, grade F, #209 of 257 statewide, top 82%, 790 students, 82% FRL) — zoned schools average 88% FRL vs 59% district-wide (29 pts higher); higher-poverty schools than district average — tighter screening recommended.
- Market conditions: 105 active listings in the ZIP; 49 units permitted in DeKalb County in 2024 (0 in 5+ unit buildings).
- DeKalb County population projected to shrink 8% by 2050 — rents likely to lag national; underwrite the cash flow, not the appreciation.
- At projected returns (-3.0% appreciation + 3.0% rent growth), your $25k cash investment doubles in ~10 years — after that, you're playing with house money.
- Climate carrying-cost: major wildfire risk; extreme-heat days projected 7→19/yr by 2055 (HVAC capex compounding) — expect insurance premiums to compound above CPI over the hold.
- Cap rate 9.3% vs local median 2.9% in Fort Payne — top-decile yield for the area; either an underpriced asset or a hidden risk that comps aren't pricing in. Stress-test before assuming the spread holds.
Questions for listing agent
- Have any recent inspections been done? Can we get a copy of the seller's disclosures and any deferred-maintenance estimates?
- Is there a deadline driving the sale (1031 exchange, divorce, estate, relocation)? That informs how much negotiation room exists.
- Schools are F-rated, which usually means shorter tenancies and higher turnover. Who's the typical renter profile here, and what's been the actual vacancy rate?
- What's the average days-on-market for RENTAL listings here right now (not sales)? A rising rental-DOM trend means longer vacancies and softer asking-rent achievability than the comps imply.
- What's the recent tenant-quality profile in this submarket — average credit score on applications, eviction rate, late-payment / NSF rate, and stable-employment percentage? A property-management company in the area should have these aggregated.
- How much new for-sale + rental construction is in the pipeline within 1–3 miles? Heavy new supply typically softens prices + rents 12–24 months out; constrained supply supports both.
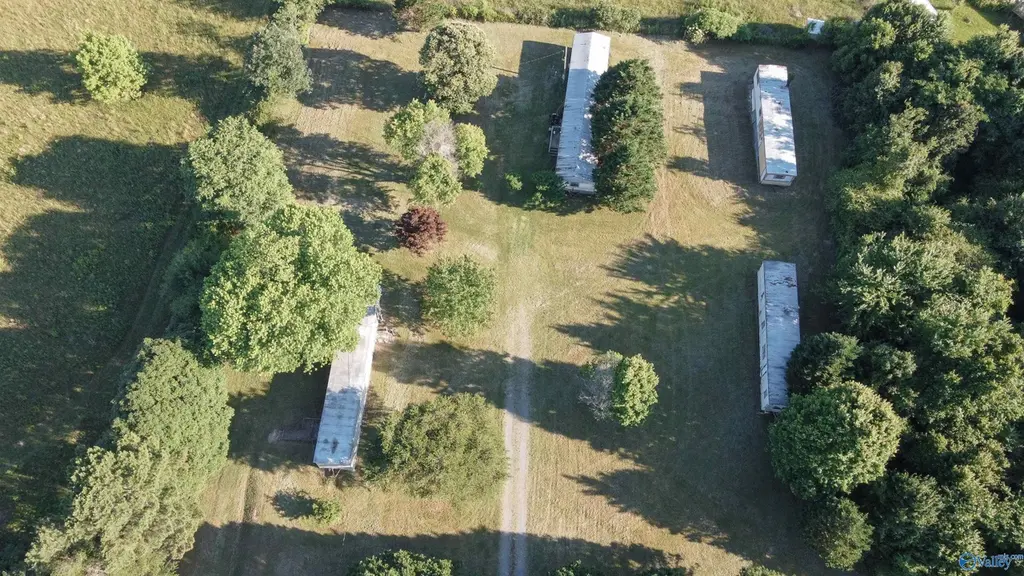
Repairs flagged (vision-AI assessment)
- Major: Roof — No visible roof in the satellite image.
- Major: Exterior — No visible exterior in the satellite image.
- Major: Flooring — No visible flooring in the satellite image.
- Major: Interior walls/paint — No visible interior walls/paint in the satellite image.
- Major: HVAC/mechanicals — No visible HVAC/mechanicals in the satellite image.
- Major: Landscaping/curb appeal — No visible landscaping/curb appeal in the satellite image.
CashFlowRE · CFR-HRQCHS5EY278BG
· Data 11 h ago
cashflowre.app · 2026-05-29