2228 County Road 255 · Fort Payne, AL
Flood risk 1/10 · Minimal
- FEMA flood zone
- X (unshaded)
- Chance of flooding over 30 yrs
- 0.0%
- Est. flood insurance / yr
- $507 – $1,088
Fire risk 7/10 · Major
- Est. fire insurance / yr
- $916 – $1,700
Heat risk 5/10 · Moderate
- Hot days now (above 104°F)
- 7 days/yr
- Hot days in 30 yrs
- 19 days/yr
Wind risk 4/10 · Minor
- Chance of severe wind over 30 yrs
- 17.0%
Air-quality risk 2/10 · Minimal
- Unhealthy air days now
- 2 days/yr
- Unhealthy air days in 30 yrs
- 2 days/yr
Risk factors via First Street. Map © Google.
Why this score? — see what drove the B- grade
The composite is a weighted blend of 9 inputs, each scored 0–100. Each bar is that input's sub-score; the figure is the points it added to the 100-point composite (weight × sub-score).
- Cash flow +30.0/30.0
- 1% rule +10.0/10.0
- DSCR +10.0/10.0
- ARV discount +7.5/15.0
- Livability +3.4/5.0
- Rent growth +2.5/5.0
- Schools +2.3/10.0
- Condition / age +1.0/5.0
- Appreciation +0.0/10.0
$90,000
🖨 Deal sheet (PDF) 📄 Offer letter ✓ Due diligence
Listing remarks
Unlock the potential of this unique 1.34-acre property tucked away in a peaceful, secluded setting just 5 miles from Little River Canyon. With two septic tanks and three water meters already in place, this property offers incredible flexibility for investors, rental income opportunities, multi-family living, or future expansion. The combination of existing infrastructure and ample space creates endless possibilities for cabins, vacation rentals, long-term rentals, or a private retreat. Surrounded by natural beauty while still providing convenient access to one of Alabama’s most popular outdoor destinations, this is a rare chance to invest in a property with tremendous future potential
Key facts
- 1.34-acre property
- Three water meters
- Two septic tanks
Tags
Property features AI
Finance
- Other: Located in Metes And Bounds subdivision
- HOA & community: No homeowners association
Exterior
- Parking: Gravel driveway
- Utilities: Septic tank
- Home design: Manufactured home; Residential property
- Construction: Foundation details: see remarks
- Exterior features: Front porch; Approximately 1.34-acre lot
Interior
- Kitchen: Range; Dishwasher; Refrigerator
- Bathrooms: Two full bathrooms
- Heating & cooling: Central heating; Central cooling
- Interior features: Five total rooms
Neighborhood map
What this means for you Summary
Snapshot
- This is a 3-bed/2.0-bath manufactured listed at $90k. Condition is rated poor.
Deal economics
- At list price, monthly cash flow is $483 ($6k/yr) — positive.
- The deal already cash-flows at list — no discount required.
- Meets the 1% rule at list price ($1k rent vs $90k).
- Cap rate 12.7% vs local median 2.9% in Fort Payne — top-decile yield for the area; either an underpriced asset or a hidden risk that comps aren't pricing in. Stress-test before assuming the spread holds.
Location & tenants
- Location reads 67/100 on livability (#86 in AL) — a middle-class / working-renter tenant base. Strengths: cost of living A+, housing A+, health & safety A-; Watch: amenities F, commute F, employment F.
- Dekalb County (rural): math 18% / reading 37% proficiency, ranked #82 of 129 in AL (top 64%) — low school quality limits family demand, transient renter base, plan for 1-2y turnover.
- Zoned schools: Crossville Elementary School (math 17% / reading 27%, grade F, #442 of 627 statewide, top 72%, 578 students, 94% FRL); Crossville Middle School (math 8% / reading 20%, grade F, #209 of 257 statewide, top 82%, 790 students, 82% FRL) — zoned schools average 88% FRL vs 59% district-wide (29 pts higher); higher-poverty schools than district average — tighter screening recommended.
- Market conditions: 105 active listings in the ZIP; 49 units permitted in DeKalb County in 2024 (0 in 5+ unit buildings).
Forward outlook
- Local home prices are declining (-3.0%/yr); year-one equity from $622 of loan paydown is wiped out by about $3k of value loss. Plan a longer hold.
- DeKalb County population projected to shrink 8% by 2050 — rents likely to lag national; underwrite the cash flow, not the appreciation.
- At projected returns (-3.0% appreciation + 3.0% rent growth), your $25k cash investment doubles in ~6 years — after that, you're playing with house money.
Negotiation context
- Only 12 days on market — expect competitive offers; lowballing is unlikely to land.
Risks & watch-outs
- Climate carrying-cost: major wildfire risk; extreme-heat days projected 7→19/yr by 2055 (HVAC capex compounding) — expect insurance premiums to compound above CPI over the hold.
Questions for the listing agent
- Have any recent inspections been done? Can we get a copy of the seller's disclosures and any deferred-maintenance estimates?
- Is there a deadline driving the sale (1031 exchange, divorce, estate, relocation)? That informs how much negotiation room exists.
- Schools are F-rated, which usually means shorter tenancies and higher turnover. Who's the typical renter profile here, and what's been the actual vacancy rate?
- What's the average days-on-market for RENTAL listings here right now (not sales)? A rising rental-DOM trend means longer vacancies and softer asking-rent achievability than the comps imply.
- What's the recent tenant-quality profile in this submarket — average credit score on applications, eviction rate, late-payment / NSF rate, and stable-employment percentage? A property-management company in the area should have these aggregated.
- How much new for-sale + rental construction is in the pipeline within 1–3 miles? Heavy new supply typically softens prices + rents 12–24 months out; constrained supply supports both.
Investment metrics
- 1% rule
- 1.55% ✓
- Cap rate
- 12.74%
- Cash-on-cash
- 23.02%
- DSCR
- 2.02
- GRM
- 5.4
CMA / ARV
No comps found within radius.
Projected returns pro-forma
-3.0% appreciation · 3.0% rent growth · sell at horizon
- IRR
- 16.0%
- Equity multiple
- 1.64×
- Total profit
- $16,226
- Equity at exit
- $13,419
- IRR
- 24.6%
- Equity multiple
- 3.14×
- Total profit
- $53,861
- Equity at exit
- $7,782
Cash invested: $25,200 (down + closing). Projections, not guarantees.
Landlord ↔ Tenant lean methodology
- Overall (STATE)
- 90 Strongly Landlord-Friendly
- State Alabama
- 90 Strongly Landlord-Friendly · R+15
- County
- — inherits STATE
- City
- — inherits STATE
ZIP-level market 35967
- Home prices YoY
- -15.6%
- Active inventory
- 105
- Price-to-rent
- 5.4×
Monthly cashflow live
- Estimated rent
- $1,399 medium interval (Pro) →
- Mortgage (P&I)
- −$472
- Tax est. 1.5%
- −$112 /mo · $1,350/yr
- Insurance
- −$38
- HOA
- −$0
- Vacancy / Maint / Mgmt
- −$294
- Net cashflow
- $483
Break-even live
Sensitivity live
| Price | -10% $546 | -5% $515 | +0% $483 | +5% $452 | +10% $421 |
|---|---|---|---|---|---|
| Rent | -10% $373 | -5% $428 | +0% $483 | +5% $539 | +10% $594 |
| Rate | -1.0pp $529 | -0.5pp $506 | base $483 | +0.5pp $460 | +1.0pp $436 |
UW: 25.0% down · 7.5% · 30yr · 1.5% tax · 5.0% vac · 8.0% maint · 8.0% mgmt
Financing live
Cash to close
- Down payment
- $22,500
- Closing costs
- $2,700
- Reserves months
- —
- Total cash needed
- —
Loan-product check · same deal, 3 products live
Conventional
25% down · 7.5% · 30yr
- Down + closing
- —
- Monthly P&I
- —
- Monthly cashflow
- —
- DSCR
- —
- Eligible?
- —
Personal DTI + credit; lowest rate.
DSCR
20% down · 8.5% · 30yr
- Down + closing
- —
- Monthly P&I
- —
- Monthly cashflow
- —
- DSCR
- —
- Eligible?
- —
No personal income docs; deal must DSCR.
Hard money
10% down · 12.0% · 12mo
- Down + closing
- —
- Monthly P&I
- —
- Monthly cashflow
- —
- DSCR
- —
- Eligible?
- —
Short-term bridge; refi at stabilization.
Listing history 9 events
-
2026-06-21statusdays on market $90,000 Contingent 12 DOM
-
2026-06-19days on market $90,000 Active 10 DOM
-
2026-06-18days on market $90,000 Active 9 DOM
-
2026-06-17days on market $90,000 Active 8 DOM
-
2026-06-16days on market $90,000 Active 7 DOM
-
2026-06-15days on market $90,000 Active 6 DOM
-
2026-06-14days on market $90,000 Active 4 DOM
-
2026-06-12remarks 693-char remark
-
2026-06-12$90,000 Active 3 DOM
ⓘ Source: listings_history table (triggers on properties + properties_extension) + one-shot
backfill from property_details.listing_events for pre-trigger history.
Climate risk First Street
- Flood 1/10 Low FEMA zone X (unshaded) · 0% chance over 30 yrs
- Wildfire 7/10 Severe
- Heat 5/10 Major 7 d/yr ≥104°F today · 19 d/yr by 30 yrs out
- Wind 4/10 Moderate 17% chance of damaging wind over 30 yrs
- Air quality 2/10 Low 2 unhealthy d/yr today · 2 by 30 yrs out
Nearby sold comps map
Loading sold comps map…
Walkable amenities ~0.75 mi
Loading nearby amenities…
Taxation est. · year 1
- Rental income
- $16,791
- − Mortgage interest
- −$5,041
- − Property taxes
- −$1,350
- − Insurance
- −$450
- − Repairs & maintenance
- −$1,343
- − Management
- −$1,343
- − Depreciation
- −$2,618
- Taxable income
- $4,645
- Est. tax owed @ 24.0%
- −$1,115
- After-tax cash flow
- $4,686/yr
For passive investors: Depreciation is non-cash, so a rental often shows a tax loss while cash-flowing — sheltering income. Rental losses are passive: they offset passive income freely, and up to $25,000/yr can offset ordinary (W-2) income if you actively participate and your MAGI is under $100k (phasing out to $0 by $150k); unused losses carry forward. On sale, claimed depreciation is recaptured at up to 25%, and gains may owe capital-gains tax (a 1031 exchange can defer both). Figures are a year-1 estimate at your 24.0% rate — not tax advice; consult a CPA.
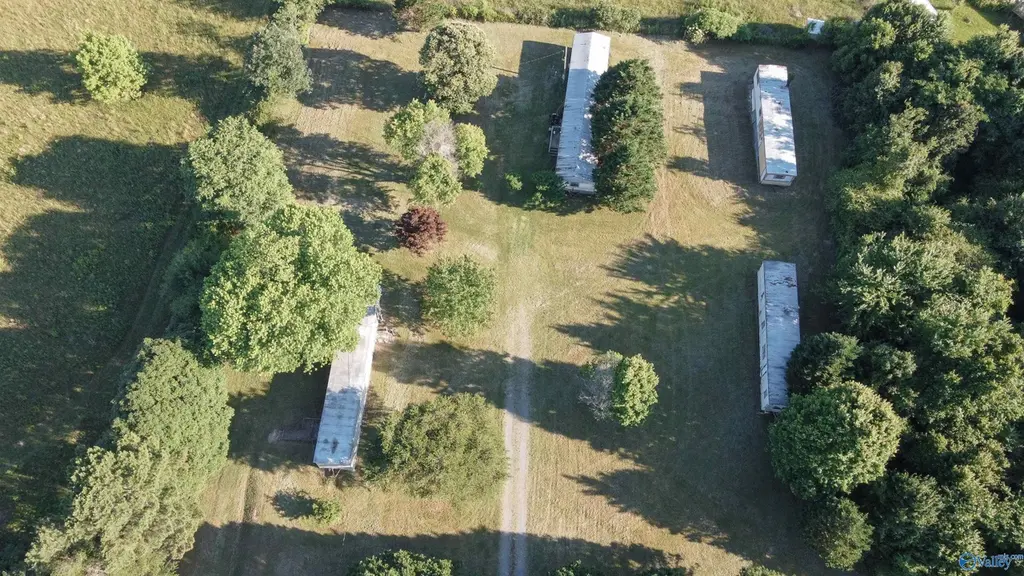
Condition & rehab AI · 2 photos
This manufactured home requires extensive repairs and updates to its roof, exterior, interior, HVAC, and landscaping. Significant investment is needed to bring it up to a livable condition.
Repairs flagged
- Major Roof — No visible roof in the satellite image.
- Major Exterior — No visible exterior in the satellite image.
- Major Flooring — No visible flooring in the satellite image.
- Major Interior walls/paint — No visible interior walls/paint in the satellite image.
- Major HVAC/mechanicals — No visible HVAC/mechanicals in the satellite image.
- Major Landscaping/curb appeal — No visible landscaping/curb appeal in the satellite image.
Value-add opportunities
- Both Roof replacement — A new roof would significantly improve the home's appearance and functionality.
- Both Exterior painting and landscaping — A fresh coat of paint and well-maintained landscaping would enhance curb appeal and attract potential buyers/tenants.
- Both Interior painting and updates — Updating the interior with fresh paint and modern decor would make the home more appealing and increase its value.
- Both HVAC system upgrade — Upgrading the HVAC system would improve comfort and energy efficiency, making the home more attractive to buyers/tenants.
- Both Landscaping and curb appeal — A well-maintained and aesthetically pleasing landscape would enhance the home's curb appeal and attract potential buyers/tenants.
Renovation cost estimate screening
| Repair item | Severity | Est. cost |
|---|---|---|
| Roof · No visible roof in the satellite image. | Major | $15,000–50,000 |
| Exterior · No visible exterior in the satellite image. | Major | $15,000–50,000 |
| Flooring · No visible flooring in the satellite image. | Major | $15,000–50,000 |
| Interior walls/paint · No visible interior walls/paint in the satellite image. | Major | $15,000–50,000 |
| HVAC/mechanicals · No visible HVAC/mechanicals in the satellite image. | Major | $15,000–50,000 |
| Landscaping/curb appeal · No visible landscaping/curb appeal in the satellite image. | Major | $15,000–50,000 |
| Total estimated repair cost · 6 items | $90,000–300,000 |
Value-add ROI direction
- Both Roof replacement — A new roof would significantly improve the home's appearance and functionality. ↑
- Both Exterior painting and landscaping — A fresh coat of paint and well-maintained landscaping would enhance curb appeal and attract potential buyers/tenants. ↑
- Both Interior painting and updates — Updating the interior with fresh paint and modern decor would make the home more appealing and increase its value. ↑
- Both HVAC system upgrade — Upgrading the HVAC system would improve comfort and energy efficiency, making the home more attractive to buyers/tenants. ↑
- Both Landscaping and curb appeal — A well-maintained and aesthetically pleasing landscape would enhance the home's curb appeal and attract potential buyers/tenants. ↑
ⓘ Cost ranges are severity-bucket heuristics (US national rule-of-thumb). Get contractor quotes + a written scope before underwriting a rehab budget.
Schools (NCES district)
- District
- Dekalb County
- NCES district ID
- 0101140
- Math proficiency
- 18% ▼ -19.00%
- Reading proficiency
- 37% ▲ 2.00%
- Median HH income
- $36,655
- Composite
- 22.78/100
- National rank
- #8023
- State rank
- #82 of 129 in AL
Livability — Fort Payne
- Score
- 67/100
- State rank
- #86
- US rank
- #10977
Category grades
Schools grade is shown separately in the Schools card above.
Census & demographics
- Population (ZIP)
- 17,342
Population outlook (DeKalb County) Hauer SSP2
- Today (2025)
- 71,722 people
- By 2030
- 71,373 · -0.5%
- By 2040
- 69,536 · -3.0%
- By 2050
- 66,020 · -8.0%
- By 2075
- 53,325 · -25.7%
- By 2100
- 36,127 · -49.6%
Race, ethnicity, and origin ACS 2023
- Neighborhood character
- Predominantly White (73%)
- Race & ethnicity
- White 73% Hispanic / Latino 22% Two or more races 5% Black 1%
- Hispanic origin (detail)
- Mexican 9% Puerto Rican 3%
- Common ancestry
- Lithuanian 4% Slovak 3% Serbian 1%
- Foreign-born
- 9% · Canada
- Languages at home
- 80% English-only · Spanish 19% Other Indo-European 1%
Political lean MEDSL · DeKalb
- 2024 margin
- Solid R (+74.0) · D 12.7% · R 86.7%
- 2008→2024 swing
- -22.7pp toward R · 2008: -51.2pp · 2024: -74.0pp
- All cycles
- 2024: R+74.0 2020: R+69.8 2016: R+69.4 2012: R+54.9 2008: R+51.2
Not yet ingested
- Civics
- —
Market trends
- HPI YoY
- ▼ -45.03%
- Current HPI
- 243.3645
- Rent YoY
- —
- Metro
- —
- State GDP YoY
- ▲ 2.94%
- F500 in state
- 4
Industry mix (Fortune 500 HQ in AL)
| Industry | F500 HQs | Revenue |
|---|---|---|
| Financial Services | 1 | $8B |
|
||
| Healthcare | 1 | $5B |
|
||
Price history
1 event — show timeline
- 2026-06-09 Listed $90,000 VMLS
Cash-flow waterfall
monthlySold comps — $/sqft
last 12 mo · ≤1 miLoading sold comps…