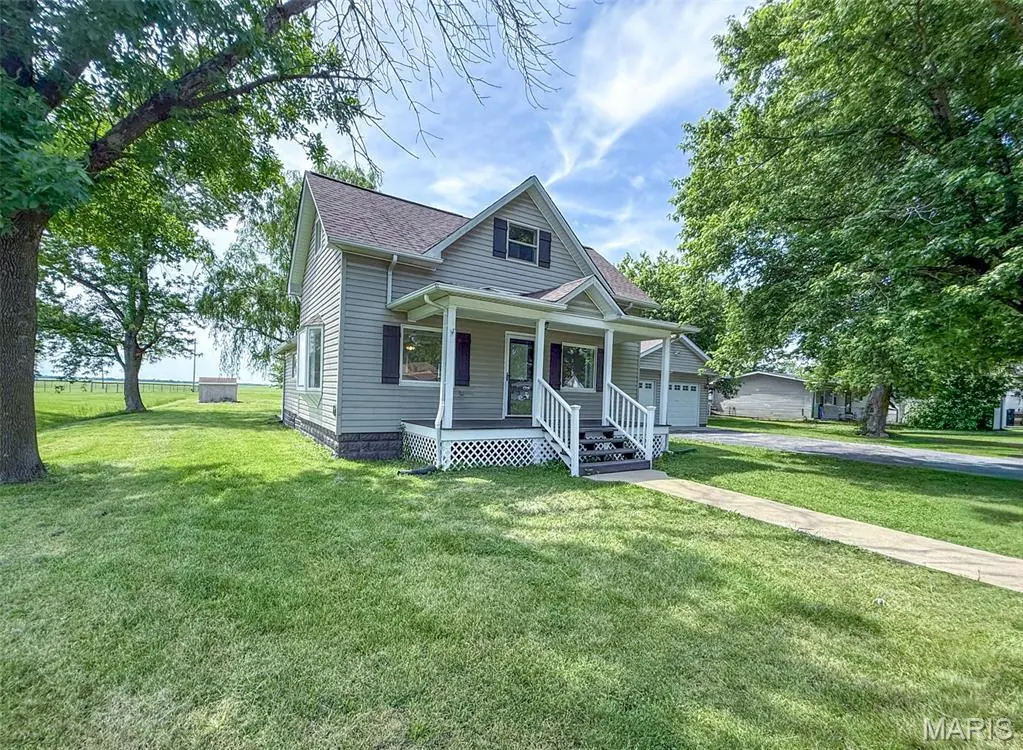
104 N 6th St
Witt, IL 62094
$148,900F
4 bd · 1.0 ba ·
896 sqft ·
Built 1950
· SingleFamily
· Active
· 17 DOM
Cashflow @ list (25.0% down · 7.5%)
Estimated rent
$942/mo
Mortgage (P&I)
−$781
Tax + insurance
−$258
HOA
−$0
Vac / Maint / Mgmt
−$198
Net cashflow
$-294/mo
Annual
$-3,533/yr
Cap rate
3.92%
Cash-on-cash
-8.47%
DSCR
0.62
1% rule
0.63%
Cash to close
$41,692
Investor read
- This is a 4-bed/1.0-bath single-family listed at $149k.
- At list price, monthly cash flow is $-294 ($-4k/yr) — negative.
- To cash-flow at today's rent, offer at most $97k (34.9% below list).
- To meet the 1% rule (rent ≥ 1% of price), the offer needs to be $94k (36.7% below list).
- It's been on market 17 days — a 2% lower offer ($147k) is reasonable based on typical stale-listing flexibility.
- Recommended offer: $94k (36.7% below list) — sets the bar for 1% rule.
- In year one you build about $4k of equity ($1k loan paydown + $3k appreciation (2.1% local appreciation)).
- Location reads 54/100 on livability (#1,266 in IL) — a working-class tenant base; expect higher turnover. Strengths: cost of living A+, housing B; Watch: crime F, amenities F, commute F.
- Hillsboro CUSD 3 (town): math 20% / reading 36% proficiency, ranked #282 of 620 in IL (top 46%) — low school quality limits family demand, transient renter base, plan for 1-2y turnover.
- Zoned schools: Hillsboro High School (math 12% / reading 17%, grade F, #479 of 693 statewide, top 71%, 468 students, 0% FRL) — zoned schools average 0% FRL vs 44% district-wide (44 pts lower); this property's tenant base skews higher-income than the district average.
- Zoned-school proficiency averages 14% at this address vs 28% district-wide (-14 pts) — the specific schools serving this property underperform the Hillsboro CUSD 3 average; the district grade overstates school quality for this exact location.
- Watch-outs: built in 1950 — expect roof / HVAC / electrical / plumbing capex.
- Market conditions: 5 active listings in the ZIP; 12 units permitted in Montgomery County in 2024 (0 in 5+ unit buildings).
- Montgomery County population projected at -20% by 2050 — secular population decline; favor cash flow + early exit over multi-decade hold.
- 5 sale attempts since 2y ago with the ask held roughly flat each time — persistent listings suggest the price (not the market) is what's stuck; bring a comps-based counter.
- Current owner paid $60k; list at $149k implies a 148% gain — meaningful room to come down on a strong offer.
- By year 8, paydown + projected appreciation supports a ~$31k cash-out refi (75% LTV) — recoverable capital for the next deal without selling this one.
Questions for listing agent
- What do current leases actually rent for vs. the listed asking? Can we see a recent rent roll and the last 12 months of T-12 income?
- Built in 1950 — when were the roof, HVAC, electrical panel, plumbing, and water heater last replaced?
- Is there a deadline driving the sale (1031 exchange, divorce, estate, relocation)? That informs how much negotiation room exists.
- Schools are F-rated, which usually means shorter tenancies and higher turnover. Who's the typical renter profile here, and what's been the actual vacancy rate?
- Crime grade is F in this area — have there been break-ins, vandalism, or insurance claims at this property in the last 3 years? What carrier currently insures it and at what premium?
- The area grade is low — what's the realistic commute time and amenity access for the typical tenant pool here? Any planned neighborhood developments (good or bad) we should know about?
- What's the average days-on-market for RENTAL listings here right now (not sales)? A rising rental-DOM trend means longer vacancies and softer asking-rent achievability than the comps imply.
- What's the recent tenant-quality profile in this submarket — average credit score on applications, eviction rate, late-payment / NSF rate, and stable-employment percentage? A property-management company in the area should have these aggregated.
CashFlowRE · CFR-HSDGVQBA6QX0B2
· Data 2 days ago
cashflowre.app · 2026-05-29