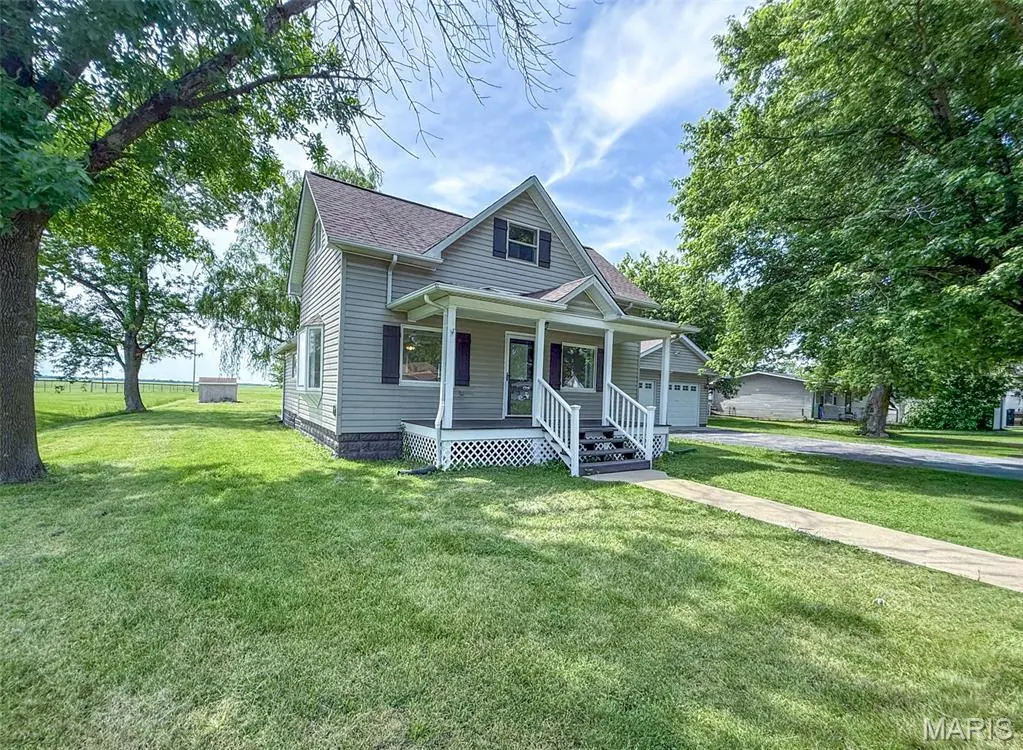
104 N 6th St · Witt, IL
Flood risk 1/10 · Minimal
- FEMA flood zone
- —
- Chance of flooding over 30 yrs
- 0.0%
- Est. flood insurance / yr
- —
Fire risk 1/10 · Minimal
- Est. fire insurance / yr
- $804 – $1,492
Heat risk 4/10 · Minor
- Hot days now (above 105°F)
- 7 days/yr
- Hot days in 30 yrs
- 20 days/yr
Wind risk 2/10 · Minimal
- Chance of severe wind over 30 yrs
- 2.0%
Air-quality risk 4/10 · Minor
- Unhealthy air days now
- 3 days/yr
- Unhealthy air days in 30 yrs
- 5 days/yr
Risk factors via First Street. Map © Google.
Why this score? — see what drove the F grade
The composite is a weighted blend of 9 inputs, each scored 0–100. Each bar is that input's sub-score; the figure is the points it added to the 100-point composite (weight × sub-score).
- ARV discount +7.5/15.0
- Appreciation +6.0/10.0
- Cash flow +5.9/30.0
- Livability +2.7/5.0
- Rent growth +2.5/5.0
- Condition / age +2.5/5.0
- Schools +2.4/10.0
- 1% rule +1.3/10.0
- DSCR +0.2/10.0
$148,900
🖨 Deal sheet 📄 Offer letter ✓ Due diligence
Listing remarks
Spacious, move in ready four bedroom, one bathroom home on nearly half an acre adjacent to the park—meticulously renovated throughout! Bright living room with abundant natural light and new flooring that flows through the main level. Upgraded kitchen with new countertops, cabinetry, counter seating, and a large pantry. Also on the main level is a remodeled bath, sizable laundry room, a mud room, and an extra bonus room ideal for an office or craft space. There are three roomy upstairs bedrooms with new carpeting. Outside you will find an attached two car garage and a beautiful back deck with pergola—perfect for morning coffee or evening relaxing! Call today to schedule a showi
Key facts
- Upgraded kitchen
- Sizable laundry room
- Large pantry
Tags
Property features AI
Finance
- Other: Ownership type: Private
- Financial info: Lease not considered
Exterior
- Parking: 2 total parking spaces; 2-car garage with garage door opener (garage faces front); Garage approximately 24 x 32; Asphalt parking
- Utilities: Public water; Public sewer; Electric service by Ameren; Cable available; Electricity connected; Water connected
- Home design: Single-family residence; Private ownership; One-and-one-half levels; Estimated above-grade finished area
- Construction: Vinyl siding; Shingle roof; Block foundation; Year built information from public records
- Exterior features: Covered patio/porch; Patio; Porch; No fencing
Interior
- Kitchen: Dishwasher; Self-cleaning oven; Refrigerator
- Bedrooms: 4 bedrooms total, including 1 bedroom on the main level and 3 bedrooms on the upper level
- Flooring: Carpet; Concrete
- Bathrooms: 1 full bathroom (located on the main level)
- Heating & cooling: Electric heating; Central air conditioning
- Interior features: Breakfast bar; Eat-in kitchen; Pantry
- Laundry & utility: Main-level laundry
Neighborhood map
What this means for you Summary
Snapshot
- This is a 4-bed/1.0-bath single-family listed at $149k.
Deal economics
- At list price, monthly cash flow is $-294 ($-4k/yr) — negative.
- To cash-flow at today's rent, offer at most $97k (34.9% below list).
- To meet the 1% rule (rent ≥ 1% of price), the offer needs to be $94k (36.7% below list).
- Recommended offer: $94k (36.7% below list) — sets the bar for 1% rule.
Location & tenants
- Location reads 54/100 on livability (#1,266 in IL) — a working-class tenant base; expect higher turnover. Strengths: cost of living A+, housing B; Watch: crime F, amenities F, commute F.
- Hillsboro CUSD 3 (town): math 20% / reading 36% proficiency, ranked #282 of 620 in IL (top 46%) — low school quality limits family demand, transient renter base, plan for 1-2y turnover.
- Zoned schools: Hillsboro High School (math 12% / reading 17%, grade F, #479 of 693 statewide, top 71%, 468 students, 0% FRL) — zoned schools average 0% FRL vs 44% district-wide (44 pts lower); this property's tenant base skews higher-income than the district average.
- Zoned-school proficiency averages 14% at this address vs 28% district-wide (-14 pts) — the specific schools serving this property underperform the Hillsboro CUSD 3 average; the district grade overstates school quality for this exact location.
- Market conditions: 5 active listings in the ZIP; 12 units permitted in Montgomery County in 2024 (0 in 5+ unit buildings).
Forward outlook
- In year one you build about $4k of equity ($1k loan paydown + $3k appreciation (2.1% local appreciation)).
- Montgomery County population projected at -20% by 2050 — secular population decline; favor cash flow + early exit over multi-decade hold.
- By year 8, paydown + projected appreciation supports a ~$31k cash-out refi (75% LTV) — recoverable capital for the next deal without selling this one.
Negotiation context
- It's been on market 17 days — a 2% lower offer ($147k) is reasonable based on typical stale-listing flexibility.
- 5 sale attempts since 2y ago with the ask held roughly flat each time — persistent listings suggest the price (not the market) is what's stuck; bring a comps-based counter.
- Current owner paid $60k; list at $149k implies a 148% gain — meaningful room to come down on a strong offer.
Risks & watch-outs
- Watch-outs: built in 1950 — expect roof / HVAC / electrical / plumbing capex.
Questions for the listing agent
- What do current leases actually rent for vs. the listed asking? Can we see a recent rent roll and the last 12 months of T-12 income?
- Built in 1950 — when were the roof, HVAC, electrical panel, plumbing, and water heater last replaced?
- Is there a deadline driving the sale (1031 exchange, divorce, estate, relocation)? That informs how much negotiation room exists.
- Schools are F-rated, which usually means shorter tenancies and higher turnover. Who's the typical renter profile here, and what's been the actual vacancy rate?
- Crime grade is F in this area — have there been break-ins, vandalism, or insurance claims at this property in the last 3 years? What carrier currently insures it and at what premium?
- The area grade is low — what's the realistic commute time and amenity access for the typical tenant pool here? Any planned neighborhood developments (good or bad) we should know about?
- What's the average days-on-market for RENTAL listings here right now (not sales)? A rising rental-DOM trend means longer vacancies and softer asking-rent achievability than the comps imply.
- What's the recent tenant-quality profile in this submarket — average credit score on applications, eviction rate, late-payment / NSF rate, and stable-employment percentage? A property-management company in the area should have these aggregated.
- How much new for-sale + rental construction is in the pipeline within 1–3 miles? Heavy new supply typically softens prices + rents 12–24 months out; constrained supply supports both.
Investment metrics
- 1% rule
- 0.63% ✗
- Cap rate
- 3.92%
- Cash-on-cash
- -8.47%
- DSCR
- 0.62
- GRM
- 13.2
CMA / ARV
- ARV (on-the-fly)
- $20,608
- Comps found
- 1
Show comp detail 1 sale within ~0.75 mi
| Address | Dist | Beds/Ba | Sqft | Sold | Price | $/sf | Match |
|---|---|---|---|---|---|---|---|
| 207 N 1st St | 0.37mi | 3/1.0 (-1) | 1,008 (+12%) | 3mo | $23,000 | $23 | 54 |
Match score weights: distance 35% · size 25% · config 20% · recency 20%. Top-matched comps best support the ARV.
Projected returns pro-forma
2.08% appreciation · 3.0% rent growth · sell at horizon
- IRR
- -3.5%
- Equity multiple
- 0.81×
- Total profit
- $-7,929
- Equity at exit
- $59,359
- IRR
- 1.3%
- Equity multiple
- 1.18×
- Total profit
- $7,324
- Equity at exit
- $85,964
Cash invested: $41,692 (down + closing). Projections, not guarantees.
Landlord ↔ Tenant lean methodology
- Overall (STATE)
- 43 Moderately Tenant-Leaning
- State Illinois
- 43 Moderately Tenant-Leaning · D+7
- County
- — inherits STATE
- City
- — inherits STATE
ZIP-level market 62094
- Home prices YoY
- 2.0%
- Active inventory
- 5
- Price-to-rent
- 13.2×
Monthly cashflow live
- Estimated rent
- $942 medium interval (Pro) →
- Mortgage (P&I)
- −$781
- Tax from tax record
- −$196 /mo · $2,352/yr
- Insurance
- −$62
- HOA
- −$0
- Vacancy / Maint / Mgmt
- −$198
- Net cashflow
- $-294
Break-even live
UW: 25.0% down · 7.5% · 30yr · 1.5% tax · 5.0% vac · 8.0% maint · 8.0% mgmt
Financing live
Cash to close
- Down payment
- $37,225
- Closing costs
- $4,467
- Reserves months
- —
- Total cash needed
- —
Loan-product check · same deal, 3 products live
Conventional
25% down · 7.5% · 30yr
- Down + closing
- —
- Monthly P&I
- —
- Monthly cashflow
- —
- DSCR
- —
- Eligible?
- —
Personal DTI + credit; lowest rate.
DSCR
20% down · 8.5% · 30yr
- Down + closing
- —
- Monthly P&I
- —
- Monthly cashflow
- —
- DSCR
- —
- Eligible?
- —
No personal income docs; deal must DSCR.
Hard money
10% down · 12.0% · 12mo
- Down + closing
- —
- Monthly P&I
- —
- Monthly cashflow
- —
- DSCR
- —
- Eligible?
- —
Short-term bridge; refi at stabilization.
Listing history 12 events
-
2026-06-18days on market $148,900 Active 17 DOM
-
2026-06-17days on market $148,900 Active 16 DOM
-
2026-06-16days on market $148,900 Active 15 DOM
-
2026-06-15days on market $148,900 Active 14 DOM
-
2026-06-13days on market $148,900 Active 12 DOM
-
2026-06-12days on market $148,900 Active 11 DOM
-
2026-06-09days on market $148,900 Active 8 DOM
-
2026-06-08days on market $148,900 Active 7 DOM
-
2026-06-07days on market $148,900 Active 6 DOM
-
2026-06-04days on market $148,900 Active 2 DOM
-
2026-06-01remarks 687-char remark
-
2026-06-01$148,900 Active 1 DOM
ⓘ Source: listings_history table (triggers on properties + properties_extension) + one-shot
backfill from property_details.listing_events for pre-trigger history.
Tax reassessment forecast IL · Partial reset (capped growth)
- Current annual tax
- $2,352 · $196/mo
- Projected year-2 tax
- $2,866 · $239/mo
- Expected delta
- +$514/yr (+$43/mo · 21.9%)
ⓘ Screening estimate from a state-policy table — verify with the county assessor before closing.
Climate risk First Street
- Flood 1/10 Low 0% chance over 30 yrs
- Wildfire 1/10 Low
- Heat 4/10 Moderate 7 d/yr ≥105°F today · 20 d/yr by 30 yrs out
- Wind 2/10 Low 2% chance of damaging wind over 30 yrs
- Air quality 4/10 Moderate 3 unhealthy d/yr today · 5 by 30 yrs out
Nearby sold comps map
Loading sold comps map…
Walkable amenities ~0.75 mi
Loading nearby amenities…
Taxation est. · year 1
- Rental income
- $11,308
- − Mortgage interest
- −$8,341
- − Property taxes
- −$2,352
- − Insurance
- −$744
- − Repairs & maintenance
- −$905
- − Management
- −$905
- − Depreciation
- −$4,332
- Taxable loss
- −$6,269
- Est. tax savings @ 24.0%
- +$1,505
- After-tax cash flow
- $-2,028/yr
For passive investors: Depreciation is non-cash, so a rental often shows a tax loss while cash-flowing — sheltering income. Rental losses are passive: they offset passive income freely, and up to $25,000/yr can offset ordinary (W-2) income if you actively participate and your MAGI is under $100k (phasing out to $0 by $150k); unused losses carry forward. On sale, claimed depreciation is recaptured at up to 25%, and gains may owe capital-gains tax (a 1031 exchange can defer both). Figures are a year-1 estimate at your 24.0% rate — not tax advice; consult a CPA.
Schools (NCES district)
- District
- Hillsboro CUSD 3
- NCES district ID
- 1719200
- Math proficiency
- 20% ▼ -4.00%
- Reading proficiency
- 36% ▼ -7.00%
- Median HH income
- $43,744
- Composite
- 23.89/100
- National rank
- #7794
- State rank
- #282 of 620 in IL
Livability — Witt
- Score
- 54/100
- State rank
- #1266
- US rank
- #23794
Category grades
Schools grade is shown separately in the Schools card above.
Census & demographics
- Census place
- Witt, IL
- Population (ZIP)
- 1,018
Population outlook (Montgomery County) Hauer SSP2
- Today (2025)
- 27,471 people
- By 2030
- 26,410 · -3.9%
- By 2040
- 24,233 · -11.8%
- By 2050
- 21,948 · -20.1%
- By 2075
- 16,686 · -39.3%
- By 2100
- 11,369 · -58.6%
Race, ethnicity, and origin ACS 2023
- Neighborhood character
- Predominantly White (95%)
- Race & ethnicity
- White 95% Black 3% Hispanic / Latino 1% Two or more races 1%
- Common ancestry
- Lithuanian 2% German 1% Iranian 1%
- Foreign-born
- 0%
Political lean MEDSL · Montgomery
- 2024 margin
- Solid R (+44.0) · D 27.1% · R 71.1% · Other 1.8%
- 2008→2024 swing
- -46.7pp toward R · 2008: 2.6pp · 2024: -44.0pp
- All cycles
- 2024: R+44.0 2020: R+41.0 2016: R+40.0 2012: R+14.2 2008: D+2.6
Not yet ingested
- Civics
- —
Market trends
- HPI YoY
- ▲ 2.08%
- Current HPI
- 103.233
- Rent YoY
- —
- Metro
- —
- State GDP YoY
- ▲ 1.59%
- F500 in state
- 60
Industry mix (Fortune 500 HQ in IL)
| Industry | F500 HQs | Revenue |
|---|---|---|
| Insurance | 4 | $201B |
|
||
| Consumer Goods | 4 | $87B |
|
||
| Industrial Machinery | 3 | $64B |
|
||
| Healthcare | 2 | $55B |
|
||
| Retail / Pharmacy | 1 | $148B |
|
||
| Agriculture / Food | 1 | $86B |
|
||
Price history
+148.2% since first listed9 events — show timeline
- 2026-06-01 Listed $148,900 MARIS as Distributed by MLS Grid
- 2025-10-17 Relisted — MARIS as Distributed by MLS Grid
- 2025-10-17 Price Changed $150,000 MARIS as Distributed by MLS Grid
- 2025-04-03 Listed $160,000 MARIS as Distributed by MLS Grid
- 2025-01-04 Delisted — MARIS as Distributed by MLS Grid
- 2024-12-16 Relisted — MARIS as Distributed by MLS Grid
- 2024-12-02 Contingent — MARIS as Distributed by MLS Grid
- 2024-07-10 Listed $160,000 MARIS as Distributed by MLS Grid
- 2005-08-01 Sold (Public Records) $60,000 Public Records
Property tax history
+6.7%/yrLatest (2024): $2,352 · +1.6% YoY. Source: county tax records.
Cash-flow waterfall
monthlySold comps — $/sqft
last 12 mo · ≤1 miLoading sold comps…