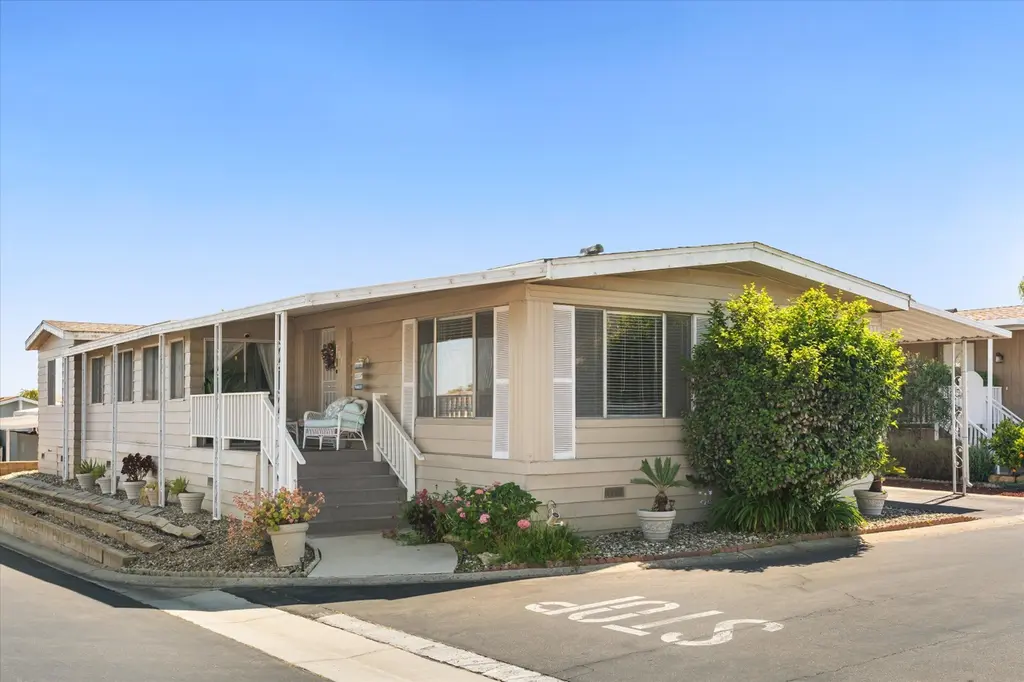
3950 Via Real #191
Carpinteria, CA 93013
$695,000F
2 bd · 2.0 ba ·
156 sqft ·
Built 1973
· Manufactured
· Active
· 12 DOM
Cashflow @ list (25.0% down · 7.5%)
Estimated rent
$4,620/mo
Mortgage (P&I)
−$3,645
Tax + insurance
−$1,158
HOA
−$0
Vac / Maint / Mgmt
−$970
Net cashflow
$-1,153/mo
Annual
$-13,837/yr
Cap rate
4.30%
Cash-on-cash
-7.11%
DSCR
0.68
1% rule
0.66%
Cash to close
$194,600
Investor read
- This is a 2-bed/2.0-bath manufactured listed at $695k.
- At list price, monthly cash flow is $-1k ($-14k/yr) — negative.
- To cash-flow at today's rent, offer at most $528k (24.0% below list).
- To meet the 1% rule (rent ≥ 1% of price), the offer needs to be $462k (33.5% below list).
- Only 12 days on market — expect competitive offers; lowballing is unlikely to land.
- Recommended offer: $462k (33.5% below list) — sets the bar for 1% rule.
- Local home prices are declining (-3.0%/yr); year-one equity from $5k of loan paydown is wiped out by about $21k of value loss. Plan a longer hold.
- Location reads 68/100 on livability (#283 in CA) — a middle-class / working-renter tenant base. Strengths: commute A+, employment A+, crime B+; Watch: amenities F, cost of living F.
- Carpinteria Unified (suburban): math 27% / reading 43% proficiency, ranked #255 of 517 in CA (top 49%) — families likely to look elsewhere, expect single-tenant / working-renter base with shorter leases.
- Zoned schools: Canalino Elementary (math 27% / reading 37%, grade F, #779 of 1,571 statewide, top 52%, 498 students, 62% FRL); Carpinteria Middle (math 24% / reading 45%, grade F, #183 of 498 statewide, top 38%, 406 students, 81% FRL); Carpinteria Senior High (math 15% / reading 47%, grade F, #702 of 1,170 statewide, top 61%, 653 students, 70% FRL) — zoned schools average 71% FRL vs 51% district-wide (20 pts higher); higher-poverty schools than district average — tighter screening recommended.
- Market conditions: Rents rising fast (+15.2%/yr); 78 active listings in the ZIP; 22 comparable units currently listed for rent nearby; rentals at typical pace (median 26d on market — plan ~3-4 weeks tenant-placement turnaround); high-income renter base; 719 units permitted in Santa Barbara County in 2024 (217 in 5+ unit buildings).
- Santa Barbara County population projected at +20% by 2050 — long-run rental-demand tailwind backs the buy-and-hold thesis.
- 2 sale attempts with the ask held roughly flat each time — persistent listings suggest the price (not the market) is what's stuck; bring a comps-based counter.
- Climate carrying-cost: extreme-heat days projected 7→18/yr by 2055 (HVAC capex compounding) — expect insurance premiums to compound above CPI over the hold.
- Cap rate 4.3% vs local median 3.0% in Carpinteria — top-decile yield for the area; either an underpriced asset or a hidden risk that comps aren't pricing in. Stress-test before assuming the spread holds.
- At $4,620/mo this rent would consume 50% of the median local household income ($110k/yr) (locally 718% of renters already pay >50% of income on rent) — very limited rent-growth headroom before tenants either downsize or default.
Questions for listing agent
- What do current leases actually rent for vs. the listed asking? Can we see a recent rent roll and the last 12 months of T-12 income?
- Built in 1973 — when were the roof, HVAC, electrical panel, plumbing, and water heater last replaced?
- Is there a deadline driving the sale (1031 exchange, divorce, estate, relocation)? That informs how much negotiation room exists.
- Schools are D-rated, which usually means shorter tenancies and higher turnover. Who's the typical renter profile here, and what's been the actual vacancy rate?
- The area grade is low — what's the realistic commute time and amenity access for the typical tenant pool here? Any planned neighborhood developments (good or bad) we should know about?
- What's the average days-on-market for RENTAL listings here right now (not sales)? A rising rental-DOM trend means longer vacancies and softer asking-rent achievability than the comps imply.
- What's the recent tenant-quality profile in this submarket — average credit score on applications, eviction rate, late-payment / NSF rate, and stable-employment percentage? A property-management company in the area should have these aggregated.
- How much new for-sale + rental construction is in the pipeline within 1–3 miles? Heavy new supply typically softens prices + rents 12–24 months out; constrained supply supports both.
CashFlowRE · CFR-HSM60C7C8J79H2
· Data 1 day ago
cashflowre.app · 2026-05-29