3950 Via Real #191 · Carpinteria, CA
Flood risk 1/10 · Minimal
- FEMA flood zone
- X (unshaded)
- Chance of flooding over 30 yrs
- 0.0%
- Est. flood insurance / yr
- $507 – $1,088
Fire risk 4/10 · Minor
- Est. fire insurance / yr
- $659 – $1,223
Heat risk 7/10 · Major
- Hot days now (above 85°F)
- 7 days/yr
- Hot days in 30 yrs
- 18 days/yr
Wind risk 1/10 · Minimal
- Chance of severe wind over 30 yrs
- —
Air-quality risk 9/10 · Severe
- Unhealthy air days now
- 12 days/yr
- Unhealthy air days in 30 yrs
- 12 days/yr
Risk factors via First Street. Map © Google.
Why this score? — see what drove the F grade
The composite is a weighted blend of 9 inputs, each scored 0–100. Each bar is that input's sub-score; the figure is the points it added to the 100-point composite (weight × sub-score).
- ARV discount +7.5/15.0
- Cash flow +6.6/30.0
- Rent growth +5.0/5.0
- Livability +3.4/5.0
- Schools +3.2/10.0
- Condition / age +2.5/5.0
- 1% rule +1.6/10.0
- DSCR +0.8/10.0
- Appreciation +0.0/10.0
$695,000
🖨 Deal sheet (PDF) 📄 Offer letter ✓ Due diligence
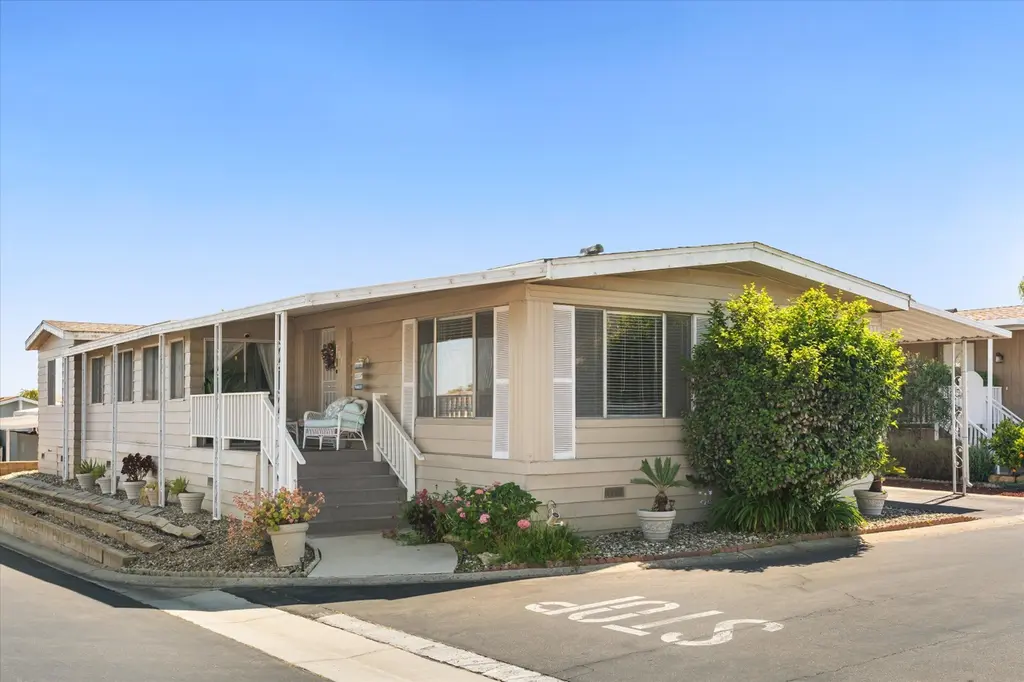
Listing remarks
Welcome home to Sandpiper Village, where this spacious and distinctive 2-bedroom, 2-bath residence offers stunning mountain views and an expansive floor plan with excellent potential for updates and personalization. Located in a highly sought-after, all-ages community just north of Carpinteria's charming downtown, this home enjoys a prime position near the top of the park, ensuring privacy and tranquility. Residents enjoy access to outstanding amenities including a clubhouse, swimming pool, hot tub, tennis courts, dog paddock, and exercise room.
Key facts
- Clubhouse
- Hot tub
- Expansive floor plan
Tags
Property features AI
Finance
- Other: Corner lot zoning: Other
- HOA & community: Community association with amenities including tennis courts, spa/hot tub, clubhouse, pool, play area, gym, and guest parking; Pets allowed
Exterior
- Parking: 2 covered carport spaces
- Utilities: Carpinteria water service
- Home design: Manufactured home (Golden West), approximately 25' x 65'
- Construction: Manufactured home construction
- Exterior features: Level, corner lot; Mountain views; Shed(s) on the property
Interior
- Kitchen: Refrigerator; Gas Range; Dishwasher
- Flooring: Laminate flooring; Carpet flooring
- Bathrooms: 2 full bathrooms
- Heating & cooling: Forced air heating
- Interior features: In-unit laundry room; Refrigerator, Gas Range, Dishwasher, Washer, Dryer; Laminate and carpet flooring
- Laundry & utility: Laundry room located inside the unit; Washer and dryer included
Neighborhood map
What this means for you Summary
Snapshot
- This is a 2-bed/2.0-bath manufactured listed at $695k.
Deal economics
- At list price, monthly cash flow is $-1k ($-14k/yr) — negative.
- To cash-flow at today's rent, offer at most $528k (24.0% below list).
- To meet the 1% rule (rent ≥ 1% of price), the offer needs to be $462k (33.5% below list).
- Recommended offer: $462k (33.5% below list) — sets the bar for 1% rule.
- Cap rate 4.3% vs local median 3.0% in Carpinteria — top-decile yield for the area; either an underpriced asset or a hidden risk that comps aren't pricing in. Stress-test before assuming the spread holds.
Location & tenants
- Location reads 68/100 on livability (#283 in CA) — a middle-class / working-renter tenant base. Strengths: commute A+, employment A+, crime B+; Watch: amenities F, cost of living F.
- Carpinteria Unified (suburban): math 27% / reading 43% proficiency, ranked #255 of 517 in CA (top 49%) — families likely to look elsewhere, expect single-tenant / working-renter base with shorter leases.
- Zoned schools: Canalino Elementary (math 27% / reading 37%, grade F, #779 of 1,571 statewide, top 52%, 498 students, 62% FRL); Carpinteria Middle (math 24% / reading 45%, grade F, #183 of 498 statewide, top 38%, 406 students, 81% FRL); Carpinteria Senior High (math 15% / reading 47%, grade F, #702 of 1,170 statewide, top 61%, 653 students, 70% FRL) — zoned schools average 71% FRL vs 51% district-wide (20 pts higher); higher-poverty schools than district average — tighter screening recommended.
- Market conditions: Rents rising fast (+15.2%/yr); 78 active listings in the ZIP; 22 comparable units currently listed for rent nearby; rentals at typical pace (median 26d on market — plan ~3-4 weeks tenant-placement turnaround); high-income renter base; 719 units permitted in Santa Barbara County in 2024 (217 in 5+ unit buildings).
- At $4,620/mo this rent would consume 50% of the median local household income ($110k/yr) (locally 718% of renters already pay >50% of income on rent) — very limited rent-growth headroom before tenants either downsize or default.
Forward outlook
- Local home prices are declining (-3.0%/yr); year-one equity from $5k of loan paydown is wiped out by about $21k of value loss. Plan a longer hold.
- Santa Barbara County population projected at +20% by 2050 — long-run rental-demand tailwind backs the buy-and-hold thesis.
Negotiation context
- Only 12 days on market — expect competitive offers; lowballing is unlikely to land.
- 2 sale attempts with the ask held roughly flat each time — persistent listings suggest the price (not the market) is what's stuck; bring a comps-based counter.
Risks & watch-outs
- Climate carrying-cost: extreme-heat days projected 7→18/yr by 2055 (HVAC capex compounding) — expect insurance premiums to compound above CPI over the hold.
Questions for the listing agent
- What do current leases actually rent for vs. the listed asking? Can we see a recent rent roll and the last 12 months of T-12 income?
- Built in 1973 — when were the roof, HVAC, electrical panel, plumbing, and water heater last replaced?
- Is there a deadline driving the sale (1031 exchange, divorce, estate, relocation)? That informs how much negotiation room exists.
- Schools are D-rated, which usually means shorter tenancies and higher turnover. Who's the typical renter profile here, and what's been the actual vacancy rate?
- The area grade is low — what's the realistic commute time and amenity access for the typical tenant pool here? Any planned neighborhood developments (good or bad) we should know about?
- What's the average days-on-market for RENTAL listings here right now (not sales)? A rising rental-DOM trend means longer vacancies and softer asking-rent achievability than the comps imply.
- What's the recent tenant-quality profile in this submarket — average credit score on applications, eviction rate, late-payment / NSF rate, and stable-employment percentage? A property-management company in the area should have these aggregated.
- How much new for-sale + rental construction is in the pipeline within 1–3 miles? Heavy new supply typically softens prices + rents 12–24 months out; constrained supply supports both.
Investment metrics
- 1% rule
- 0.66% ✗
- Cap rate
- 4.30%
- Cash-on-cash
- -7.11%
- DSCR
- 0.68
- GRM
- 12.5
CMA / ARV
No comps found within radius.
Projected returns pro-forma
-3.0% appreciation · 8.0% rent growth · sell at horizon
- IRR
- -23.3%
- Equity multiple
- 0.17×
- Total profit
- $-161,572
- Equity at exit
- $103,627
- IRR
- -8.4%
- Equity multiple
- 0.36×
- Total profit
- $-123,845
- Equity at exit
- $60,091
Cash invested: $194,600 (down + closing). Projections, not guarantees.
Landlord ↔ Tenant lean methodology
- Overall (STATE)
- 18 Strongly Tenant-Friendly
- State California
- 18 Strongly Tenant-Friendly · D+13
- County
- — inherits STATE
- City
- — inherits STATE
ZIP-level market 93013
- Rents YoY
- 15.2%
- Active inventory
- 78
- Price-to-rent
- 12.5×
Monthly cashflow live
- Estimated rent
- $4,620 high interval (Pro) →
- Mortgage (P&I)
- −$3,645
- Tax est. 1.5%
- −$869 /mo · $10,425/yr
- Insurance
- −$290
- HOA
- −$0
- Vacancy / Maint / Mgmt
- −$970
- Net cashflow
- $-1,153
Break-even live
Sensitivity live
| Price | -10% $-673 | -5% $-913 | +0% $-1,153 | +5% $-1,393 | +10% $-1,633 |
|---|---|---|---|---|---|
| Rent | -10% $-1,518 | -5% $-1,336 | +0% $-1,153 | +5% $-971 | +10% $-788 |
| Rate | -1.0pp $-803 | -0.5pp $-976 | base $-1,153 | +0.5pp $-1,333 | +1.0pp $-1,516 |
UW: 25.0% down · 7.5% · 30yr · 1.5% tax · 5.0% vac · 8.0% maint · 8.0% mgmt
Financing live
Cash to close
- Down payment
- $173,750
- Closing costs
- $20,850
- Reserves months
- —
- Total cash needed
- —
Loan-product check · same deal, 3 products live
Conventional
25% down · 7.5% · 30yr
- Down + closing
- —
- Monthly P&I
- —
- Monthly cashflow
- —
- DSCR
- —
- Eligible?
- —
Personal DTI + credit; lowest rate.
DSCR
20% down · 8.5% · 30yr
- Down + closing
- —
- Monthly P&I
- —
- Monthly cashflow
- —
- DSCR
- —
- Eligible?
- —
No personal income docs; deal must DSCR.
Hard money
10% down · 12.0% · 12mo
- Down + closing
- —
- Monthly P&I
- —
- Monthly cashflow
- —
- DSCR
- —
- Eligible?
- —
Short-term bridge; refi at stabilization.
Rent comps 22 comps
| Address | Beds | Baths | Sqft | Rent | $/sqft | DOM | Units | Dist |
|---|---|---|---|---|---|---|---|---|
| 1250 Cravens Ln #3 Carpinteria, CA | 3.0 | 2.5 | 1853 | $6,200 | $3.35 | 25d | 1 | 0.19mi |
| 1256 Cravens Ln #3 Carpinteria, CA | 3.0 | 2.5 | 1956 | $6,500 | $3.32 | 18d | 1 | 0.20mi |
| 1240 Franciscan Ct #6 Carpinteria, CA | 2.0 | 2.0 | 876 | $3,995 | $4.56 | 45d | 1 | 0.32mi |
| 4140 Via Real Carpinteria, CA | 1.0–2.0 | 1.0 | 725 | $3,000 | $4.14 | 3d | 2 | 0.55mi |
| 4253 Carpinteria Ave Unit B Carpinteria, CA | 2.0 | 1.0 | — | $4,000 | — | 25d | 1 | 0.69mi |
| 4530 Carpinteria Ave Carpinteria, CA | 1.0 | 1.0 | 695 | $3,000 | $4.32 | 3d | 1 | 0.95mi |
| 1488 Manzanita St Carpinteria, CA | 3.0 | 2.0 | 1131 | $11,500 | $10.17 | 13d | 1 | 1.10mi |
| 250 Ash Ave Unit C Carpinteria, CA | 2.0 | 1.5 | 700 | $4,950 | $7.07 | 16d | 1 | 1.23mi |
| 160 Ash Ave Unit 7 Carpinteria, CA | 2.0 | 1.0 | 850 | $3,950 | $4.65 | 45d | 1 | 1.23mi |
| 4745 Carpinteria Ave Carpinteria, CA | 2.0 | 2.0 | 1365 | $5,125 | $3.75 | 3d | 13 | 1.28mi |
| 4858 5th St Carpinteria, CA | 3.0 | 2.5 | — | $5,500 | — | 45d | 1 | 1.33mi |
| 3375 Foothill Rd Carpinteria, CA | 3.0 | 2.0 | — | $4,600 | — | 25d | 1 | 1.35mi |
| 4885 Sandyland Rd #2 Carpinteria, CA | 3.0 | 3.0 | 1780 | $10,500 | $5.90 | 45d | 1 | 1.36mi |
| 4885 Sandyland Rd #2 Carpinteria, CA | 3.0 | 3.0 | 1780 | $10,500 | $5.90 | 25d | 1 | 1.36mi |
| 3375 Foothill Rd #511 Carpinteria, CA | 3.0 | 2.0 | 1365 | $4,500 | $3.30 | 25d | 1 | 1.37mi |
| 3375 Foothill Rd #535 Carpinteria, CA | 1.0 | 1.0 | 642 | $4,400 | $6.85 | 25d | 1 | 1.38mi |
| 3375 Foothill Rd #624 Carpinteria, CA | 2.0 | 2.0 | — | $4,800 | — | 25d | 1 | 1.41mi |
| 3375 Foothill Rd Carpinteria, CA | 1.0–3.0 | 1.0–2.0 | 1003 | $4,650 | $4.63 | 45d | 4 | 1.43mi |
| 3375 Foothill Rd Carpinteria, CA | 1.0–3.0 | 1.0–2.0 | 991 | $4,750 | $4.79 | 25d | 5 | 1.43mi |
| 231 Linden Ave #17 Carpinteria, CA | 1.0 | 1.0 | — | $2,750 | — | 25d | 1 | 1.43mi |
| 4975 Sandyland Rd #212 Carpinteria, CA | 2.0 | 1.0 | 800 | $9,500 | $11.88 | 45d | 1 | 1.43mi |
| 4932 Sawyer Ave Carpinteria, CA | 2.0 | 2.0 | 1570 | $6,000 | $3.82 | 45d | 1 | 1.50mi |
Listing history 9 events
-
2026-06-21days on market $695,000 Active 12 DOM
-
2026-06-18days on market $695,000 Active 9 DOM
-
2026-06-17days on market $695,000 Active 8 DOM
-
2026-06-16days on market $695,000 Active 7 DOM
-
2026-06-15days on market $695,000 Active 6 DOM
-
2026-06-13days on market $695,000 Active 4 DOM
-
2026-06-13days on market $695,000 Active 3 DOM
-
2026-06-10remarks 552-char remark
-
2026-06-10$695,000 Active 1 DOM
ⓘ Source: listings_history table (triggers on properties + properties_extension) + one-shot
backfill from property_details.listing_events for pre-trigger history.
Climate risk First Street
- Flood 1/10 Low FEMA zone X (unshaded) · 0% chance over 30 yrs
- Wildfire 4/10 Moderate
- Heat 7/10 Severe 7 d/yr ≥85°F today · 18 d/yr by 30 yrs out
- Wind 1/10 Low
- Air quality 9/10 Extreme 12 unhealthy d/yr today · 12 by 30 yrs out
Nearby sold comps map
Loading sold comps map…
Walkable amenities ~0.75 mi
Loading nearby amenities…
Taxation est. · year 1
- Rental income
- $55,442
- − Mortgage interest
- −$38,931
- − Property taxes
- −$10,425
- − Insurance
- −$3,475
- − Repairs & maintenance
- −$4,435
- − Management
- −$4,435
- − Depreciation
- −$20,218
- Taxable loss
- −$26,478
- Est. tax savings @ 24.0%
- +$6,355
- After-tax cash flow
- $-7,482/yr
For passive investors: Depreciation is non-cash, so a rental often shows a tax loss while cash-flowing — sheltering income. Rental losses are passive: they offset passive income freely, and up to $25,000/yr can offset ordinary (W-2) income if you actively participate and your MAGI is under $100k (phasing out to $0 by $150k); unused losses carry forward. On sale, claimed depreciation is recaptured at up to 25%, and gains may owe capital-gains tax (a 1031 exchange can defer both). Figures are a year-1 estimate at your 24.0% rate — not tax advice; consult a CPA.
Schools (NCES district)
- District
- Carpinteria Unified
- NCES district ID
- 0607560
- Math proficiency
- 27% ▼ -16.00%
- Reading proficiency
- 43% ▼ -5.00%
- Median HH income
- $70,780
- Composite
- 32.27/100
- National rank
- #5758
- State rank
- #255 of 517 in CA
Livability — Carpinteria
- Score
- 68/100
- State rank
- #283
- US rank
- #9548
Category grades
Schools grade is shown separately in the Schools card above.
Census & demographics
- Census place
- Carpinteria, CA
- County
- Santa Barbara County · 410,380 people
- City population
- 16,317
- Metro
- Santa Maria-Santa Barbara, CA
- Population (ZIP)
- 16,317
- Household income
- $110,359
- Rent vs Own
- Severe rent burden
- 718.0
Population outlook (Santa Barbara County) Hauer SSP2
- Today (2025)
- 484,679 people
- By 2030
- 505,323 · +4.3%
- By 2040
- 545,783 · +12.6%
- By 2050
- 584,263 · +20.5%
- By 2075
- 682,586 · +40.8%
- By 2100
- 723,188 · +49.2%
Race, ethnicity, and origin ACS 2023
- Neighborhood character
- Diverse neighborhood (Simpson 0.57)
- Race & ethnicity
- White 51% Hispanic / Latino 41% Two or more races 17% Asian 3% Native American 1%
- Hispanic origin (detail)
- Mexican 38%
- Common ancestry
- Slovak 4% Lithuanian 3% Romanian 2%
- Foreign-born
- 22% · Canada
- Languages at home
- 66% English-only · Spanish 29% Other Indo-European 1% Russian/Polish/Slavic 1%
Political lean MEDSL · Santa Barbara
- 2024 margin
- Strong D (+26.7) · D 61.8% · R 35.1% · Other 3.1%
- 2008→2024 swing
- +3.8pp toward D · 2008: 22.9pp · 2024: 26.7pp
- All cycles
- 2024: D+26.7 2020: D+32.1 2016: D+28.2 2012: D+17.1 2008: D+22.9
Not yet ingested
- Civics
- —
Market trends
- HPI YoY
- ▼ -1390.66%
- Current HPI
- 345.0001
- Rent YoY
- ▲ 15.23%
- Metro
- Santa Maria-Santa Barbara, CA
- State GDP YoY
- ▲ 3.21%
- F500 in state
- 116
Industry mix (Fortune 500 HQ in CA)
| Industry | F500 HQs | Revenue |
|---|---|---|
| Technology | 27 | $1,492B |
|
||
| Financial Services | 3 | $174B |
|
||
| Retail | 3 | $44B |
|
||
| Insurance | 3 | $26B |
|
||
| Media / Entertainment | 2 | $115B |
|
||
| Pharmaceuticals / Biotech | 2 | $62B |
|
||
Price history
+0.0% since first listed4 events — show timeline
- 2026-06-09 Listed $695,000 SBMLS
- 2026-05-11 Listing Removed — SBMLS
- 2026-05-09 Listed $695,000 SBMLS
- 2026-05-09 Coming Soon — SBMLS
Property tax history
+1.9%/yrLatest (2025): $143 · +2.0% YoY. Source: county tax records.
Cash-flow waterfall
monthlySold comps — $/sqft
last 12 mo · ≤1 miLoading sold comps…