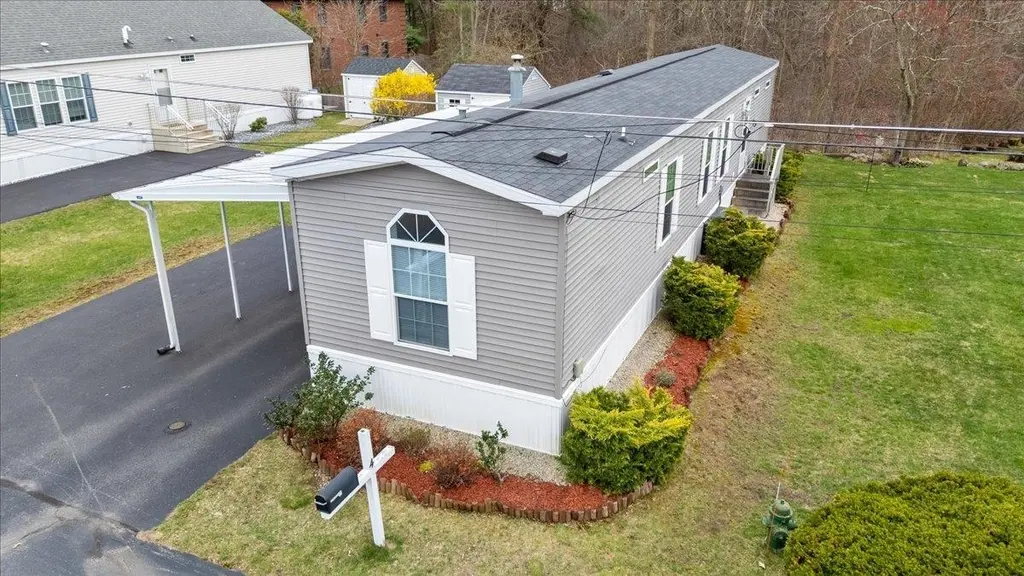
4 Trailerhome Dr
Methuen Town, MA 03079
$234,900D+
2 bd · 1.0 ba ·
924 sqft ·
Built 2017
· Manufactured
· Pending
· 6 DOM
Cashflow @ list (25.0% down · 7.5%)
Estimated rent
$2,805/mo
Mortgage (P&I)
−$1,232
Tax + insurance
−$294
HOA
−$385
Vac / Maint / Mgmt
−$589
Net cashflow
$305/mo
Annual
$3,665/yr
Cap rate
7.85%
Cash-on-cash
5.57%
DSCR
1.25
1% rule
1.19%
Cash to close
$65,772
Investor read
- This is a 2-bed/1.0-bath manufactured listed at $235k.
- At list price, monthly cash flow is $305 ($4k/yr) — positive.
- The deal already cash-flows at list — no discount required.
- Meets the 1% rule at list price ($3k rent vs $235k).
- Only 6 days on market — expect competitive offers; lowballing is unlikely to land.
- Local home prices are declining (-3.0%/yr); year-one equity from $2k of loan paydown is wiped out by about $7k of value loss. Plan a longer hold.
- Location reads 73/100 on livability (#108 in MA) — a middle-class / working-renter tenant base. Strengths: housing A+, crime A, employment A; Watch: commute D+, amenities F, cost of living F.
- Salem School District (suburban): math 47% / reading 56% proficiency, ranked #28 of 98 in NH (top 29%) — acceptable for families but not a draw, mixed tenant base, ~2y average lease; only 14% free/reduced lunch — higher-income household profile.
- Zoned schools: Mary A. Fisk Elementary School (math 47% / reading 42%, grade F, #126 of 263 statewide, top 52%, 259 students, 16% FRL) — zoned schools at 16% FRL track the district average.
- Market conditions: Rents rising (+2.6%/yr); 20 comparable units currently listed for rent nearby; rentals leasing fast (median 5d on market — plan ~1-2 weeks tenant-placement turnaround); high-income renter base; 1,276 units permitted in Rockingham County in 2024 (593 in 5+ unit buildings).
- Current owner paid $158k; 49% above their basis — modest negotiation headroom, anchor on the comps not their cost.
- Climate carrying-cost: major wind risk, 27% chance of damaging wind over 30y — expect insurance premiums to compound above CPI over the hold.
- Cap rate 7.9% vs local median 2.9% in Methuen Town — top-decile yield for the area; either an underpriced asset or a hidden risk that comps aren't pricing in. Stress-test before assuming the spread holds.
- This rent runs 30% of the median local income ($110k/yr) — at the standard rent-burdened threshold; future hikes will face affordability resistance.
Questions for listing agent
- What does the HOA fee cover, when was the last increase, and are there any pending special assessments or reserve-fund shortfalls?
- Is there a deadline driving the sale (1031 exchange, divorce, estate, relocation)? That informs how much negotiation room exists.
- Schools are D-rated, which usually means shorter tenancies and higher turnover. Who's the typical renter profile here, and what's been the actual vacancy rate?
- The area grade is low — what's the realistic commute time and amenity access for the typical tenant pool here? Any planned neighborhood developments (good or bad) we should know about?
- What's the average days-on-market for RENTAL listings here right now (not sales)? A rising rental-DOM trend means longer vacancies and softer asking-rent achievability than the comps imply.
- What's the recent tenant-quality profile in this submarket — average credit score on applications, eviction rate, late-payment / NSF rate, and stable-employment percentage? A property-management company in the area should have these aggregated.
- How much new for-sale + rental construction is in the pipeline within 1–3 miles? Heavy new supply typically softens prices + rents 12–24 months out; constrained supply supports both.
CashFlowRE · CFR-HTPECK4QQAEQYQ
· Data 3 weeks ago
cashflowre.app · 2026-05-29