 🏢 Co-op
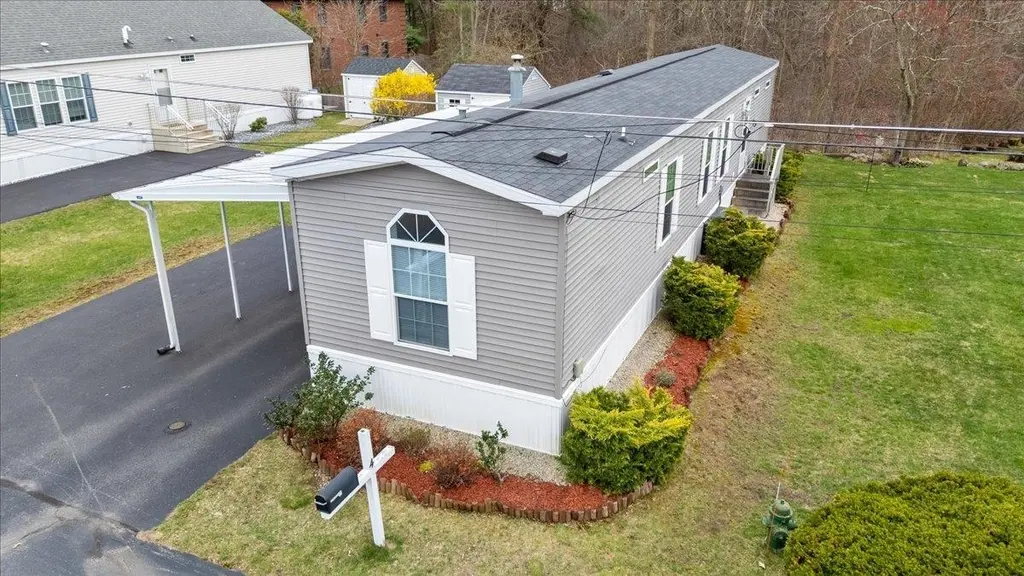
4 Trailerhome Dr · Methuen Town, MA
Flood risk 4/10 · Minor
- FEMA flood zone
- X (unshaded)
- Chance of flooding over 30 yrs
- 0.22%
- Est. flood insurance / yr
- $507 – $1,088
Fire risk 2/10 · Minimal
- Est. fire insurance / yr
- $507 – $941
Heat risk 4/10 · Minor
- Hot days now (above 97°F)
- 7 days/yr
- Hot days in 30 yrs
- 15 days/yr
Wind risk 6/10 · Moderate
- Chance of severe wind over 30 yrs
- 27.0%
Air-quality risk 2/10 · Minimal
- Unhealthy air days now
- 2 days/yr
- Unhealthy air days in 30 yrs
- 2 days/yr
Risk factors via First Street. Map © Google.
Why this score? — see what drove the D+ grade
The composite is a weighted blend of 9 inputs, each scored 0–100. Each bar is that input's sub-score; the figure is the points it added to the 100-point composite (weight × sub-score).
- Cash flow +20.4/30.0
- 1% rule +6.9/10.0
- DSCR +6.5/10.0
- Schools +4.6/10.0
- Livability +3.7/5.0
- Rent growth +3.2/5.0
- Condition / age +2.5/5.0
- ARV discount +0.0/15.0
- Appreciation +0.0/10.0
$234,900
🖨 Deal sheet 📄 Offer letter ✓ Due diligence
Listing remarks
Tucked away on a quiet dead-end street, 4 Trailerhome Drive offers a unique opportunity to own in a resident-owned 55+ cooperative community—far from the feel of a traditional trailer park. This well-maintained single-wide mobile home features 2 comfortable bedrooms and 1 full bath, making it an ideal option for those seeking affordable, low-maintenance living. Set on a peaceful one-street neighborhood, the property provides a sense of privacy and community that’s hard to find. As part of a cooperative, residents take pride in ownership of the land, creating a more stable and welcoming environment. Conveniently located just minutes from the highly desirable Tuscan Village, you&r
Key facts
- Built 2017
- Listed 6 days
Tags
Neighborhood map
What this means for you Summary
Snapshot
- This is a 2-bed/1.0-bath manufactured listed at $235k.
Deal economics
- At list price, monthly cash flow is $305 ($4k/yr) — positive.
- The deal already cash-flows at list — no discount required.
- Meets the 1% rule at list price ($3k rent vs $235k).
- Cap rate 7.9% vs local median 2.9% in Methuen Town — top-decile yield for the area; either an underpriced asset or a hidden risk that comps aren't pricing in. Stress-test before assuming the spread holds.
Location & tenants
- Location reads 73/100 on livability (#108 in MA) — a middle-class / working-renter tenant base. Strengths: housing A+, crime A, employment A; Watch: commute D+, amenities F, cost of living F.
- Salem School District (suburban): math 47% / reading 56% proficiency, ranked #28 of 98 in NH (top 29%) — acceptable for families but not a draw, mixed tenant base, ~2y average lease; only 14% free/reduced lunch — higher-income household profile.
- Zoned schools: Mary A. Fisk Elementary School (math 47% / reading 42%, grade F, #126 of 263 statewide, top 52%, 259 students, 16% FRL) — zoned schools at 16% FRL track the district average.
- Market conditions: Rents rising (+2.6%/yr); 20 comparable units currently listed for rent nearby; rentals leasing fast (median 5d on market — plan ~1-2 weeks tenant-placement turnaround); high-income renter base; 1,276 units permitted in Rockingham County in 2024 (593 in 5+ unit buildings).
- This rent runs 30% of the median local income ($110k/yr) — at the standard rent-burdened threshold; future hikes will face affordability resistance.
Forward outlook
- Local home prices are declining (-3.0%/yr); year-one equity from $2k of loan paydown is wiped out by about $7k of value loss. Plan a longer hold.
Negotiation context
- Only 6 days on market — expect competitive offers; lowballing is unlikely to land.
- Current owner paid $158k; 49% above their basis — modest negotiation headroom, anchor on the comps not their cost.
Risks & watch-outs
- Climate carrying-cost: major wind risk, 27% chance of damaging wind over 30y — expect insurance premiums to compound above CPI over the hold.
Questions for the listing agent
- What does the HOA fee cover, when was the last increase, and are there any pending special assessments or reserve-fund shortfalls?
- Is there a deadline driving the sale (1031 exchange, divorce, estate, relocation)? That informs how much negotiation room exists.
- Schools are D-rated, which usually means shorter tenancies and higher turnover. Who's the typical renter profile here, and what's been the actual vacancy rate?
- The area grade is low — what's the realistic commute time and amenity access for the typical tenant pool here? Any planned neighborhood developments (good or bad) we should know about?
- What's the average days-on-market for RENTAL listings here right now (not sales)? A rising rental-DOM trend means longer vacancies and softer asking-rent achievability than the comps imply.
- What's the recent tenant-quality profile in this submarket — average credit score on applications, eviction rate, late-payment / NSF rate, and stable-employment percentage? A property-management company in the area should have these aggregated.
- How much new for-sale + rental construction is in the pipeline within 1–3 miles? Heavy new supply typically softens prices + rents 12–24 months out; constrained supply supports both.
Investment metrics
- 1% rule
- 1.19% ✓
- Cap rate
- 7.85%
- Cash-on-cash
- 5.57%
- DSCR
- 1.25
- GRM
- 7.0
CMA / ARV
- ARV (on-the-fly)
- $171,864
- Comps found
- 8
Show comp detail 8 sales within ~0.75 mi
| Address | Dist | Beds/Ba | Sqft | Sold | Price | $/sf | Match |
|---|---|---|---|---|---|---|---|
| 4 Trailerhome Dr | 0.00mi | 2/1.0 | 924 (0%) | 1mo | $242,000 | $262 | 99 |
| 3 Friendship Dr | 0.50mi | 2/1.0 | 924 (0%) | 7mo | $175,000 | $189 | 70 |
| 75 S Policy St #36 | 0.54mi | 2/2.0 | 896 (-3%) | 9mo | $225,000 | $251 | 58 |
| 33 Brookwood Dr | 0.27mi | 2/1.5 | 868 (-6%) | 21mo | $157,000 | $181 | 58 |
| 75 South Policy St #48 | 0.54mi | 2/1.0 | 840 (-9%) | 6mo | $139,900 | $167 | 55 |
| 89 End St | 0.36mi | 2/1.0 | 792 (-14%) | 6mo | $147,000 | $186 | 54 |
| 75 S Policy St #62 | 0.54mi | 2/1.0 | 960 (+4%) | 20mo | $165,000 | $172 | 52 |
| 30 Friendship Dr #30 | 0.50mi | 3/1.0 (+1) | 864 (-6%) | 22mo | $136,500 | $158 | 43 |
Match score weights: distance 35% · size 25% · config 20% · recency 20%. Top-matched comps best support the ARV.
Projected returns pro-forma
-3.0% appreciation · 2.64% rent growth · sell at horizon
- IRR
- -8.0%
- Equity multiple
- 0.70×
- Total profit
- $-19,403
- Equity at exit
- $35,024
- IRR
- 1.1%
- Equity multiple
- 1.07×
- Total profit
- $4,920
- Equity at exit
- $20,310
Cash invested: $65,772 (down + closing). Projections, not guarantees.
Landlord ↔ Tenant lean methodology
- Overall (STATE)
- 20 Strongly Tenant-Friendly
- State Massachusetts
- 20 Strongly Tenant-Friendly · D+15
- County
- — inherits STATE
- City
- — inherits STATE
ZIP-level market 03079
- Rents YoY
- 2.6%
- Price-to-rent
- 7.0×
Monthly cashflow live
- Estimated rent
- $2,805 high interval (Pro) →
- Mortgage (P&I)
- −$1,232
- Tax from tax record
- −$196 /mo · $2,354/yr
- Insurance
- −$98
- HOA
- −$385
- Vacancy / Maint / Mgmt
- −$589
- Net cashflow
- $305
Break-even live
UW: 25.0% down · 7.5% · 30yr · 1.5% tax · 5.0% vac · 8.0% maint · 8.0% mgmt
Financing live
Cash to close
- Down payment
- $58,725
- Closing costs
- $7,047
- Reserves months
- —
- Total cash needed
- —
Loan-product check · same deal, 3 products live
Conventional
25% down · 7.5% · 30yr
- Down + closing
- —
- Monthly P&I
- —
- Monthly cashflow
- —
- DSCR
- —
- Eligible?
- —
Personal DTI + credit; lowest rate.
DSCR
20% down · 8.5% · 30yr
- Down + closing
- —
- Monthly P&I
- —
- Monthly cashflow
- —
- DSCR
- —
- Eligible?
- —
No personal income docs; deal must DSCR.
Hard money
10% down · 12.0% · 12mo
- Down + closing
- —
- Monthly P&I
- —
- Monthly cashflow
- —
- DSCR
- —
- Eligible?
- —
Short-term bridge; refi at stabilization.
Rent comps 20 comps
| Address | Beds | Baths | Sqft | Rent | $/sqft | DOM | Units | Dist |
|---|---|---|---|---|---|---|---|---|
| 800 Central St Salem, NH | 2.0 | 1.0–2.0 | 776 | $2,825 | $3.64 | 1d | 14 | 0.15mi |
| 4 Tuscan Blvd Salem, NH | 2.0 | 1.0–2.0 | 739 | $3,390 | $4.58 | 1d | 18 | 0.26mi |
| 3 Artisan Dr Salem, NH | 2.0 | 1.0–2.0 | 920 | $4,401 | $4.78 | 1d | 43 | 0.44mi |
| 15 Artisan Dr Salem, NH | 2.0 | 1.0–2.0 | 910 | $3,873 | $4.26 | 1d | 35 | 0.48mi |
| 18 Artisan Dr Salem, NH | 1.0 | 1.0 | 857 | $3,200 | $3.73 | 1d | 1 | 0.51mi |
| 22 Via Toscana Salem, NH | 2.0 | 1.0–2.0 | 846 | $4,598 | $5.43 | 1d | 61 | 0.65mi |
| 103 S Policy St Unit 10 Salem, NH | 2.0 | 1.0 | 775 | $2,100 | $2.71 | 14d | 1 | 0.73mi |
| 103 S Policy St Unit 4 Salem, NH | 1.0 | 1.0 | 650 | $2,000 | $3.08 | 14d | 1 | 0.73mi |
| 205 Main St Salem, NH | 2.0 | 1.0 | 850 | $2,262 | $2.66 | 1d | 2 | 0.84mi |
| 8 Lancelot Ct #13 Salem, NH | 2.0 | 1.0 | 914 | $1,990 | $2.18 | 24d | 1 | 1.01mi |
| 11 Lancelot Ct #7 Salem, NH | 2.0 | 1.0 | 676 | $1,850 | $2.74 | 4d | 1 | 1.02mi |
| 1 Lancelot Ct #2 Salem, NH | 2.0 | 1.0 | 728 | $1,950 | $2.68 | 24d | 1 | 1.12mi |
| 3 Lancelot Ct Salem, NH | 2.0 | 1.0 | 736 | $1,800 | $2.45 | 43d | 1 | 1.13mi |
| 8 Braemoor Woods Rd Salem, NH | 2.0 | 1.0 | 950 | $1,854 | $1.95 | 1d | 1 | 1.14mi |
| 117 Cluff Crossing Rd Salem, NH | 2.0 | 1.0 | 980 | $2,250 | $2.30 | 43d | 1 | 1.17mi |
| 9 Tiffany Rd #1 Salem, NH | 1.0 | 1.0 | 780 | $1,850 | $2.37 | 24d | 1 | 1.20mi |
| 9 Tiffany Rd #1 Salem, NH | 1.0 | 1.0 | 780 | $1,850 | $2.37 | 5d | 1 | 1.20mi |
| 4 Brook Rd #5 Salem, NH | 2.0 | 1.0 | 891 | $2,400 | $2.69 | 43d | 1 | 1.23mi |
| 14 Tiffany Rd #2 Salem, NH | 1.0 | 1.0 | 777 | $1,695 | $2.18 | 10d | 1 | 1.25mi |
| 14 Tiffany Rd Salem, NH | 1.0 | 1.0 | 777 | $1,712 | $2.20 | 5d | 2 | 1.25mi |
HOA detail
- Monthly dues
- $385 · $4,620/yr
Listing history 3 events
-
2026-04-22status Pending
-
2026-04-16$234,900 Active
-
2018-08-01soldstatus $158,000
ⓘ Source: listings_history table (triggers on properties + properties_extension) + one-shot
backfill from property_details.listing_events for pre-trigger history.
Tax reassessment forecast MA · Partial reset (capped growth)
- Current annual tax
- $2,354 · $196/mo
- Projected year-2 tax
- $2,622 · $218/mo
- Expected delta
- +$268/yr (+$22/mo · 11.4%)
ⓘ Screening estimate from a state-policy table — verify with the county assessor before closing.
Climate risk First Street
- Flood 4/10 Moderate FEMA zone X (unshaded) · 22% chance over 30 yrs
- Wildfire 2/10 Low
- Heat 4/10 Moderate 7 d/yr ≥97°F today · 15 d/yr by 30 yrs out
- Wind 6/10 Major 27% chance of damaging wind over 30 yrs
- Air quality 2/10 Low 2 unhealthy d/yr today · 2 by 30 yrs out
Nearby sold comps map
Loading sold comps map…
Walkable amenities ~0.75 mi
Loading nearby amenities…
Taxation est. · year 1
- Rental income
- $33,666
- − Mortgage interest
- −$13,158
- − Property taxes
- −$2,354
- − Insurance
- −$1,174
- − Repairs & maintenance
- −$2,693
- − Management
- −$2,693
- − HOA
- −$4,620
- − Depreciation
- −$6,833
- Taxable income
- $139
- Est. tax owed @ 24.0%
- −$33
- After-tax cash flow
- $3,632/yr
For passive investors: Depreciation is non-cash, so a rental often shows a tax loss while cash-flowing — sheltering income. Rental losses are passive: they offset passive income freely, and up to $25,000/yr can offset ordinary (W-2) income if you actively participate and your MAGI is under $100k (phasing out to $0 by $150k); unused losses carry forward. On sale, claimed depreciation is recaptured at up to 25%, and gains may owe capital-gains tax (a 1031 exchange can defer both). Figures are a year-1 estimate at your 24.0% rate — not tax advice; consult a CPA.
Schools (NCES district)
- District
- Salem School District
- NCES district ID
- 3306060
- Math proficiency
- 47% ▼ -4.00%
- Reading proficiency
- 56% ▼ -2.00%
- Median HH income
- $75,648
- Composite
- 46.45/100
- National rank
- #2446
- State rank
- #28 of 98 in NH
Livability — Methuen Town
- Score
- 73/100
- State rank
- #108
- US rank
- #5537
Category grades
Schools grade is shown separately in the Schools card above.
Census & demographics
- County
- Rockingham County
- City population
- 53,015
- Metro
- Boston-Cambridge-Newton, MA-NH
- Population (ZIP)
- 30,964
- Household income
- $110,490
- Rent vs Own
- Severe rent burden
- 702.0
Population outlook (Rockingham County) Hauer SSP2
- Today (2025)
- 316,118 people
- By 2030
- 320,929 · +1.5%
- By 2040
- 323,358 · +2.3%
- By 2050
- 314,977 · -0.4%
- By 2075
- 297,686 · -5.8%
- By 2100
- 256,363 · -18.9%
Race, ethnicity, and origin ACS 2023
- Neighborhood character
- Predominantly White (82%)
- Race & ethnicity
- White 82% Hispanic / Latino 9% Two or more races 4% Asian 4%
- Hispanic origin (detail)
- Puerto Rican 2% Dominican 4%
- Common ancestry
- Lithuanian 9% Romanian 4% Russian 4%
- Foreign-born
- 11% · Canada, Vietnam, South Korea
- Languages at home
- 88% English-only · Spanish 6% Other Asian/Pacific 2% Other Indo-European 1%
Political lean MEDSL · Rockingham
- 2024 margin
- Toss-up / Even · D 48.3% · R 50.8%
- 2008→2024 swing
- -3.5pp toward R · 2008: 1.1pp · 2024: -2.4pp
- All cycles
- 2024: R+2.4 2020: D+2.1 2016: R+5.8 2012: R+4.5 2008: D+1.1
Not yet ingested
- Civics
- —
Market trends
- HPI YoY
- ▼ -265.55%
- Current HPI
- 311.547
- Rent YoY
- ▲ 2.64%
- Metro
- Boston-Cambridge-Newton, MA-NH
- State GDP YoY
- ▲ 2.28%
- F500 in state
- 38
Industry mix (Fortune 500 HQ in MA)
| Industry | F500 HQs | Revenue |
|---|---|---|
| Technology | 3 | $17B |
|
||
| Insurance | 2 | $84B |
|
||
| Retail | 2 | $76B |
|
||
| Life Sciences | 1 | $43B |
|
||
| Energy Technology | 1 | $31B |
|
||
| Aerospace / Defense | 1 | $18B |
|
||
Price history
+48.7% since first listed3 events — show timeline
- 2026-04-22 Pending — PrimeMLS
- 2026-04-16 Listed $234,900 PrimeMLS
- 2018-08-01 Sold (Public Records) $158,000 Public Records
Property tax history
+8.2%/yrLatest (2025): $2,354 · +3.2% YoY. Source: county tax records.
Cash-flow waterfall
monthlySold comps — $/sqft
last 12 mo · ≤1 miLoading sold comps…