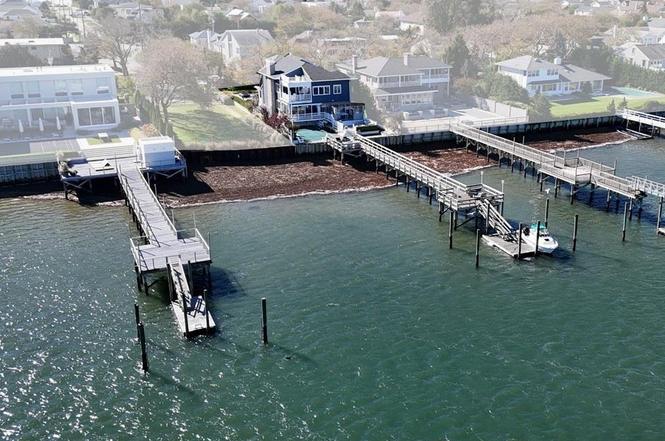
1600 Bay Blvd
Atlantic Beach, NY 11509
$2,450,000B
4 bd · 4.0 ba ·
3,513 sqft ·
Built 1942
· SingleFamily
· Pending
· 30 DOM
Cashflow @ list (25.0% down · 7.5%)
Estimated rent
$27,526/mo
Mortgage (P&I)
−$12,848
Tax + insurance
−$3,195
HOA
−$0
Vac / Maint / Mgmt
−$5,780
Net cashflow
$5,702/mo
Annual
$68,419/yr
Cap rate
9.31%
Cash-on-cash
10.78%
DSCR
1.48
1% rule
1.12%
Cash to close
$686,000
Investor read
- This is a 4-bed/4.0-bath single-family listed at $2.45M.
- At list price, monthly cash flow is $6k ($68k/yr) — positive.
- The deal already cash-flows at list — no discount required.
- Meets the 1% rule at list price ($28k rent vs $2.45M).
- It's been on market 30 days — a 2% lower offer ($2.41M) is reasonable based on typical stale-listing flexibility.
- Recommended offer: $2.41M (1.5% below list) — sets the bar for market timing.
- In year one you build about $262k of equity ($17k loan paydown + $245k appreciation (10.0% local appreciation)).
- Location reads 72/100 on livability (#376 in NY) — a middle-class / working-renter tenant base. Strengths: crime A+, commute A+, employment A+; Watch: amenities F, cost of living F.
- Lawrence Union Free School District (suburban): math 43% / reading 46% proficiency, ranked #399 of 590 in NY (top 68%) — families likely to look elsewhere, expect single-tenant / working-renter base with shorter leases.
- Zoned schools: Lawrence Elementary School At Broadway Campus (math 35% / reading 52%, grade F, #1,350 of 2,108 statewide, top 64%, 480 students, 78% FRL); Lawrence Middle School At Broadway Campus (math 12% / reading 37%, grade F, #611 of 729 statewide, top 88%, 405 students, 79% FRL); Lawrence Senior High School (math 87% / reading 30%, grade C, #877 of 1,100 statewide, top 80%, 770 students, 70% FRL) — zoned schools average 76% FRL vs 52% district-wide (24 pts higher); higher-poverty schools than district average — tighter screening recommended.
- Watch-outs: flood insurance adds $460/mo; built in 1942 — expect roof / HVAC / electrical / plumbing capex.
- Market conditions: 31 active listings in the ZIP; 7 comparable units currently listed for rent nearby; rentals at typical pace (median 26d on market — plan ~3-4 weeks tenant-placement turnaround); 824 units permitted in Nassau County in 2024 (153 in 5+ unit buildings).
- Nassau County population projected at +7% by 2050 — modest demand growth; plan on rents tracking national, not racing it.
- At projected returns (10.0% appreciation + 3.0% rent growth), your $686k cash investment doubles in ~2 years — after that, you're playing with house money.
- By year 2, paydown + projected appreciation supports a ~$421k cash-out refi (75% LTV) — recoverable capital for the next deal without selling this one.
- Climate carrying-cost: in FEMA flood zone AE (mandatory federal flood insurance); severe wind risk, 80% chance of damaging wind over 30y; extreme-heat days projected 6→13/yr by 2055 (HVAC capex compounding) — expect insurance premiums to compound above CPI over the hold.
Questions for listing agent
- Built in 1942 — when were the roof, HVAC, electrical panel, plumbing, and water heater last replaced?
- What's the actual annual flood-insurance premium (NFIP or private), and is the property in a SFHA with mandatory coverage?
- Is there a deadline driving the sale (1031 exchange, divorce, estate, relocation)? That informs how much negotiation room exists.
- What's the average days-on-market for RENTAL listings here right now (not sales)? A rising rental-DOM trend means longer vacancies and softer asking-rent achievability than the comps imply.
- What's the recent tenant-quality profile in this submarket — average credit score on applications, eviction rate, late-payment / NSF rate, and stable-employment percentage? A property-management company in the area should have these aggregated.
- How much new for-sale + rental construction is in the pipeline within 1–3 miles? Heavy new supply typically softens prices + rents 12–24 months out; constrained supply supports both.
CashFlowRE · CFR-HV9JQD0142ZQ9J
· Data 4 weeks ago
cashflowre.app · 2026-05-29