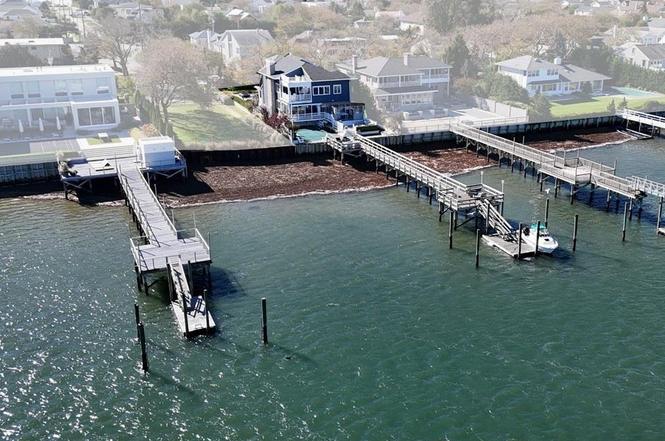
1600 Bay Blvd · Atlantic Beach, NY
Flood risk 6/10 · Moderate
- FEMA flood zone
- AE
- Chance of flooding over 30 yrs
- 0.74%
- Est. flood insurance / yr
- $2,026 – $9,024
Fire risk 2/10 · Minimal
- Est. fire insurance / yr
- $691 – $1,283
Heat risk 6/10 · Moderate
- Hot days now (above 95°F)
- 6 days/yr
- Hot days in 30 yrs
- 13 days/yr
Wind risk 8/10 · Major
- Chance of severe wind over 30 yrs
- 80.0%
Air-quality risk 4/10 · Minor
- Unhealthy air days now
- 4 days/yr
- Unhealthy air days in 30 yrs
- 6 days/yr
Risk factors via First Street. Map © Google.
Why this score? — see what drove the B grade
The composite is a weighted blend of 9 inputs, each scored 0–100. Each bar is that input's sub-score; the figure is the points it added to the 100-point composite (weight × sub-score).
- Cash flow +26.1/30.0
- Appreciation +10.0/10.0
- DSCR +8.8/10.0
- ARV discount +7.5/15.0
- 1% rule +6.2/10.0
- Schools +4.2/10.0
- Livability +3.6/5.0
- Rent growth +2.5/5.0
- Condition / age +2.5/5.0
$2,450,000
🖨 Deal sheet (PDF) 📄 Offer letter ✓ Due diligence
Listing remarks
Online Bankruptcy Auction: Spectacular Bayfront Luxury Home. Bidding opens 12/9 at 12:00 noon & Ends 12/11 at 12:00 noon (appx). The listing price of $2,450,000 exclusively represents the Opening Bid Amount Only and not the asking price. Please conduct independent due diligence as the property sells "as-is" and the information provided is not guaranteed to be accurate. Sold Subject to a Five Percent Buyers Premium.
Key facts
- 7,120 sq ft lot
- 2 garage spots
- Pool
Neighborhood map
What this means for you Summary
Snapshot
- This is a 4-bed/4.0-bath single-family listed at $2.45M.
Deal economics
- At list price, monthly cash flow is $6k ($68k/yr) — positive.
- The deal already cash-flows at list — no discount required.
- Meets the 1% rule at list price ($28k rent vs $2.45M).
- Recommended offer: $2.41M (1.5% below list) — sets the bar for market timing.
Location & tenants
- Location reads 72/100 on livability (#376 in NY) — a middle-class / working-renter tenant base. Strengths: crime A+, commute A+, employment A+; Watch: amenities F, cost of living F.
- Lawrence Union Free School District (suburban): math 43% / reading 46% proficiency, ranked #399 of 590 in NY (top 68%) — families likely to look elsewhere, expect single-tenant / working-renter base with shorter leases.
- Zoned schools: Lawrence Elementary School At Broadway Campus (math 35% / reading 52%, grade F, #1,350 of 2,108 statewide, top 64%, 480 students, 78% FRL); Lawrence Middle School At Broadway Campus (math 12% / reading 37%, grade F, #611 of 729 statewide, top 88%, 405 students, 79% FRL); Lawrence Senior High School (math 87% / reading 30%, grade C, #877 of 1,100 statewide, top 80%, 770 students, 70% FRL) — zoned schools average 76% FRL vs 52% district-wide (24 pts higher); higher-poverty schools than district average — tighter screening recommended.
- Market conditions: 31 active listings in the ZIP; 7 comparable units currently listed for rent nearby; rentals at typical pace (median 26d on market — plan ~3-4 weeks tenant-placement turnaround); 824 units permitted in Nassau County in 2024 (153 in 5+ unit buildings).
Forward outlook
- In year one you build about $262k of equity ($17k loan paydown + $245k appreciation (10.0% local appreciation)).
- Nassau County population projected at +7% by 2050 — modest demand growth; plan on rents tracking national, not racing it.
- At projected returns (10.0% appreciation + 3.0% rent growth), your $686k cash investment doubles in ~2 years — after that, you're playing with house money.
- By year 2, paydown + projected appreciation supports a ~$421k cash-out refi (75% LTV) — recoverable capital for the next deal without selling this one.
Negotiation context
- It's been on market 30 days — a 2% lower offer ($2.41M) is reasonable based on typical stale-listing flexibility.
Risks & watch-outs
- Watch-outs: flood insurance adds $460/mo; built in 1942 — expect roof / HVAC / electrical / plumbing capex.
- Climate carrying-cost: in FEMA flood zone AE (mandatory federal flood insurance); severe wind risk, 80% chance of damaging wind over 30y; extreme-heat days projected 6→13/yr by 2055 (HVAC capex compounding) — expect insurance premiums to compound above CPI over the hold.
Questions for the listing agent
- Built in 1942 — when were the roof, HVAC, electrical panel, plumbing, and water heater last replaced?
- What's the actual annual flood-insurance premium (NFIP or private), and is the property in a SFHA with mandatory coverage?
- Is there a deadline driving the sale (1031 exchange, divorce, estate, relocation)? That informs how much negotiation room exists.
- What's the average days-on-market for RENTAL listings here right now (not sales)? A rising rental-DOM trend means longer vacancies and softer asking-rent achievability than the comps imply.
- What's the recent tenant-quality profile in this submarket — average credit score on applications, eviction rate, late-payment / NSF rate, and stable-employment percentage? A property-management company in the area should have these aggregated.
- How much new for-sale + rental construction is in the pipeline within 1–3 miles? Heavy new supply typically softens prices + rents 12–24 months out; constrained supply supports both.
Investment metrics
- 1% rule
- 1.12% ✓
- Cap rate
- 9.31%
- Cash-on-cash
- 10.78%
- DSCR
- 1.48
- GRM
- 7.4
CMA / ARV
- ARV (on-the-fly)
- $1,528,155
- Comps found
- 7
Show comp detail 7 sales within ~0.75 mi
| Address | Dist | Beds/Ba | Sqft | Sold | Price | $/sf | Match |
|---|---|---|---|---|---|---|---|
| 1590 Beech St | 0.08mi | 5/4.0 (+1) | 3,300 (-6%) | 6mo | $1,325,000 | $402 | 76 |
| 1482 Park St | 0.22mi | 5/3.0 (+1) | 3,500 (-0%) | 12mo | $1,532,000 | $438 | 70 |
| 1515 Park St | 0.18mi | 5/4.0 (+1) | 3,600 (+2%) | 17mo | $1,350,000 | $375 | 68 |
| 1830 Bay Blvd | 0.47mi | 5/5.0 (+1) | 3,602 (+2%) | 20mo | $3,700,000 | $1,027 | 48 |
| 83 Ithaca Ave | 0.55mi | 5/4.5 (+1) | 4,000 (+14%) | 0mo | $2,225,000 | $556 | 44 |
| 1250 Park St | 0.65mi | 4/3.5 | 3,860 (+10%) | 21mo | $1,675,000 | $434 | 34 |
| 1263 Park St | 0.63mi | 4/2.5 | 3,102 (-12%) | 19mo | $1,350,000 | $435 | 30 |
Match score weights: distance 35% · size 25% · config 20% · recency 20%. Top-matched comps best support the ARV.
Projected returns pro-forma
10.0% appreciation · 3.0% rent growth · sell at horizon
- IRR
- 31.6%
- Equity multiple
- 3.47×
- Total profit
- $1,697,343
- Equity at exit
- $2,207,154
- IRR
- 27.3%
- Equity multiple
- 7.87×
- Total profit
- $4,712,567
- Equity at exit
- $4,759,811
Cash invested: $686,000 (down + closing). Projections, not guarantees.
Landlord ↔ Tenant lean methodology
- Overall (STATE)
- 15 Strongly Tenant-Friendly
- State New York
- 15 Strongly Tenant-Friendly · D+10
- County
- — inherits STATE
- City
- — inherits STATE
ZIP-level market 11509
- Home prices YoY
- 2.9%
- Active inventory
- 31
- Price-to-rent
- 7.4×
Monthly cashflow live
- Estimated rent
- $27,526 medium interval (Pro) →
- Mortgage (P&I)
- −$12,848
- Tax from tax record
- −$1,714 /mo · $20,571/yr
- Insurance
- −$1,021
- Flood insurance flood zone
- −$460 /mo · $5,525/yr
- HOA
- −$0
- Vacancy / Maint / Mgmt
- −$5,780
- Net cashflow
- $5,702
Break-even live
Sensitivity live
| Price | -10% $7,089 | -5% $6,395 | +0% $5,702 | +5% $5,008 | +10% $4,315 |
|---|---|---|---|---|---|
| Rent | -10% $3,527 | -5% $4,614 | +0% $5,702 | +5% $6,789 | +10% $7,876 |
| Rate | -1.0pp $6,935 | -0.5pp $6,325 | base $5,702 | +0.5pp $5,067 | +1.0pp $4,421 |
UW: 25.0% down · 7.5% · 30yr · 1.5% tax · 5.0% vac · 8.0% maint · 8.0% mgmt
Financing live
Cash to close
- Down payment
- $612,500
- Closing costs
- $73,500
- Reserves months
- —
- Total cash needed
- —
Loan-product check · same deal, 3 products live
Conventional
25% down · 7.5% · 30yr
- Down + closing
- —
- Monthly P&I
- —
- Monthly cashflow
- —
- DSCR
- —
- Eligible?
- —
Personal DTI + credit; lowest rate.
DSCR
20% down · 8.5% · 30yr
- Down + closing
- —
- Monthly P&I
- —
- Monthly cashflow
- —
- DSCR
- —
- Eligible?
- —
No personal income docs; deal must DSCR.
Hard money
10% down · 12.0% · 12mo
- Down + closing
- —
- Monthly P&I
- —
- Monthly cashflow
- —
- DSCR
- —
- Eligible?
- —
Short-term bridge; refi at stabilization.
Rent comps 7 comps
| Address | Beds | Baths | Sqft | Rent | $/sqft | DOM | Units | Dist |
|---|---|---|---|---|---|---|---|---|
| 77 Tioga Ave Atlantic Beach, NY | 4.0 | 2.5 | 2800 | $5,800 | $2.07 | 26d | 1 | 0.10mi |
| 1701 Bay Blvd Atlantic Beach, NY | 4.0 | 3.0 | 2730 | $25,000 | $9.16 | 26d | 1 | 0.17mi |
| 215 Scott Dr Atlantic Beach, NY | 5.0 | 3.0 | 2862 | $22,500 | $7.86 | 0d | 1 | 0.59mi |
| 115 Maryland Ave Long Beach, NY | 4.0 | 3.0 | 2822 | $8,500 | $3.01 | 0d | 1 | 1.26mi |
| 71 Michigan St Long Beach, NY | 5.0 | 4.5 | 3168 | $8,900 | $2.81 | 7d | 1 | 1.29mi |
| 49 Harborview W Lawrence, NY | 4.0 | 4.5 | 3877 | $35,000 | $9.03 | 45d | 1 | 1.30mi |
| 11 Michigan St Long Beach, NY | 5.0 | 3.5 | 3492 | $45,000 | $12.89 | 26d | 1 | 1.33mi |
Listing history 5 events
-
2026-04-10soldstatus $5,339,250
-
2025-12-12status Pending
-
2025-11-11$2,450,000 Active
-
2015-11-22soldstatus $2,850,000
-
2011-12-08soldstatus $2,590,000
ⓘ Source: listings_history table (triggers on properties + properties_extension) + one-shot
backfill from property_details.listing_events for pre-trigger history.
Tax reassessment forecast NY · Partial reset (capped growth)
- Current annual tax
- $20,571 · $1,714/mo
- Projected year-2 tax
- $30,988 · $2,582/mo
- Expected delta
- +$10,417/yr (+$868/mo · 50.6%)
ⓘ Screening estimate from a state-policy table — verify with the county assessor before closing.
Climate risk First Street
- Flood 6/10 Major FEMA zone AE · 74% chance over 30 yrs
- Wildfire 2/10 Low
- Heat 6/10 Major 6 d/yr ≥95°F today · 13 d/yr by 30 yrs out
- Wind 8/10 Severe 80% chance of damaging wind over 30 yrs
- Air quality 4/10 Moderate 4 unhealthy d/yr today · 6 by 30 yrs out
Nearby sold comps map
Loading sold comps map…
Walkable amenities ~0.75 mi
Loading nearby amenities…
Taxation est. · year 1
- Rental income
- $330,306
- − Mortgage interest
- −$137,238
- − Property taxes
- −$20,571
- − Insurance
- −$17,775
- − Repairs & maintenance
- −$26,425
- − Management
- −$26,425
- − Depreciation
- −$71,273
- Taxable income
- $30,601
- Est. tax owed @ 24.0%
- −$7,344
- After-tax cash flow
- $61,075/yr
For passive investors: Depreciation is non-cash, so a rental often shows a tax loss while cash-flowing — sheltering income. Rental losses are passive: they offset passive income freely, and up to $25,000/yr can offset ordinary (W-2) income if you actively participate and your MAGI is under $100k (phasing out to $0 by $150k); unused losses carry forward. On sale, claimed depreciation is recaptured at up to 25%, and gains may owe capital-gains tax (a 1031 exchange can defer both). Figures are a year-1 estimate at your 24.0% rate — not tax advice; consult a CPA.
Schools (NCES district)
- District
- Lawrence Union Free School District
- NCES district ID
- 3616830
- Math proficiency
- 43% ▼ -2.00%
- Reading proficiency
- 46% ▼ -8.00%
- Median HH income
- $91,008
- Composite
- 42.14/100
- National rank
- #3307
- State rank
- #399 of 590 in NY
Livability — Atlantic Beach
- Score
- 72/100
- State rank
- #376
- US rank
- #6459
Category grades
Schools grade is shown separately in the Schools card above.
Census & demographics
- Census place
- Atlantic Beach, NY
- City population
- 1,747
- Population (ZIP)
- 1,747
Population outlook (Nassau County) Hauer SSP2
- Today (2025)
- 1,409,302 people
- By 2030
- 1,431,482 · +1.6%
- By 2040
- 1,471,607 · +4.4%
- By 2050
- 1,502,845 · +6.6%
- By 2075
- 1,575,403 · +11.8%
- By 2100
- 1,554,356 · +10.3%
Race, ethnicity, and origin ACS 2023
- Neighborhood character
- Predominantly White (92%)
- Race & ethnicity
- White 92% Hispanic / Latino 5% Two or more races 3%
- Hispanic origin (detail)
- Mexican 2%
- Common ancestry
- Romanian 9% Scotch-Irish 8% Italian 3%
- Foreign-born
- 7% · Canada
- Languages at home
- 94% English-only · Other Indo-European 3% Spanish 1% Russian/Polish/Slavic 1%
Political lean MEDSL · Nassau
- 2024 margin
- Toss-up / Even · D 47.9% · R 52.1%
- 2008→2024 swing
- -12.6pp toward R · 2008: 8.4pp · 2024: -4.2pp
- All cycles
- 2024: R+4.2 2020: D+9.5 2016: D+5.3 2012: D+6.7 2008: D+8.4
Not yet ingested
- Civics
- —
Market trends
- HPI YoY
- ▲ 11.04%
- Current HPI
- 392.2777
- Rent YoY
- —
- Metro
- —
- State GDP YoY
- ▲ 2.60%
- F500 in state
- 92
Industry mix (Fortune 500 HQ in NY)
| Industry | F500 HQs | Revenue |
|---|---|---|
| Financial Services | 10 | $950B |
|
||
| Consumer Goods | 9 | $162B |
|
||
| Insurance | 4 | $225B |
|
||
| Telecommunications | 2 | $144B |
|
||
| Pharmaceuticals | 2 | $112B |
|
||
| Media / Entertainment | 2 | $69B |
|
||
Price history
+106.1% since first listed5 events — show timeline
- 2026-04-10 Sold (Public Records) $5,339,250 Public Records
- 2025-12-12 Pending — OneKey® MLS as Distributed by MLS Grid
- 2025-11-11 Listed $2,450,000 OneKey® MLS as Distributed by MLS Grid
- 2015-11-22 Sold (Public Records) $2,850,000 Public Records
- 2011-12-08 Sold (Public Records) $2,590,000 Public Records
Property tax history
+0.5%/yrLatest (2024): $20,571 · -2.2% YoY. Source: county tax records.
Cash-flow waterfall
monthlySold comps — $/sqft
last 12 mo · ≤1 miLoading sold comps…