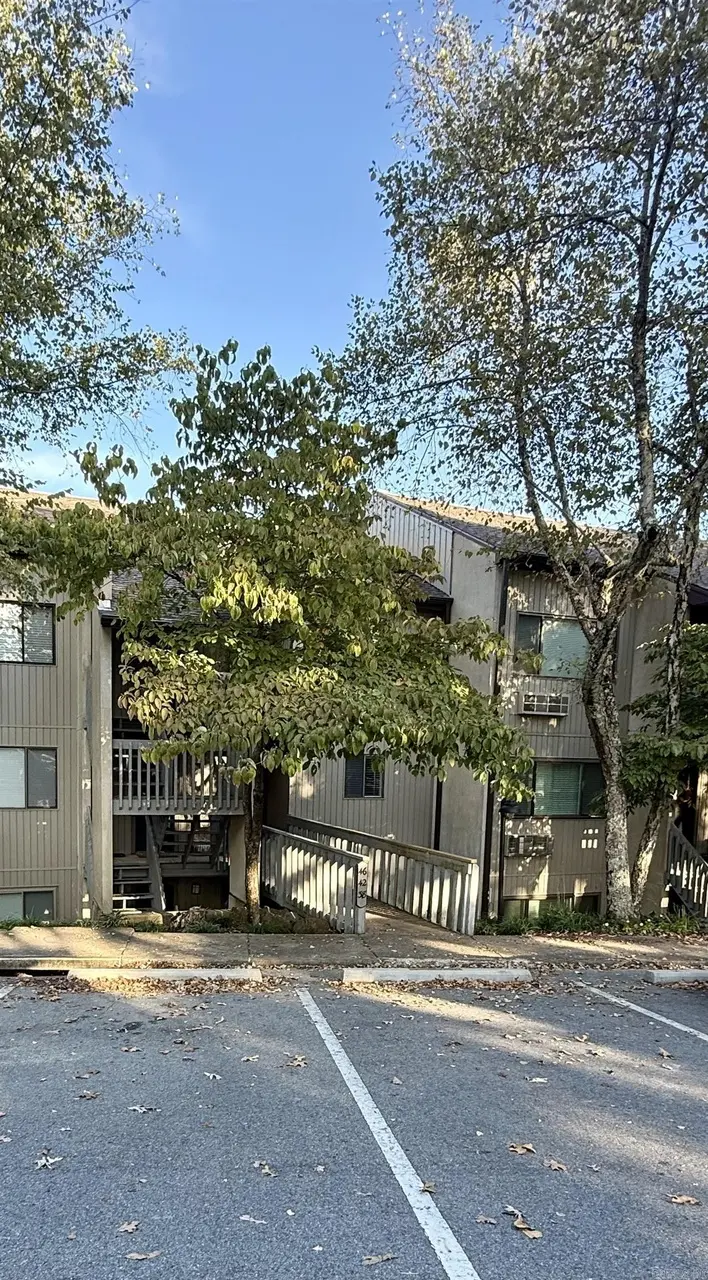
125 Chelsea Dr #38
Fairfield Bay, AR 72088
$125,000C+
2 bd · 2.0 ba ·
1,120 sqft ·
Built 1985
· Townhouse
· Active
· 260 DOM
Cashflow @ list (25.0% down · 7.5%)
Estimated rent
$2,000/mo
Mortgage (P&I)
−$656
Tax + insurance
−$208
HOA
−$402
Vac / Maint / Mgmt
−$420
Net cashflow
$314/mo
Annual
$3,770/yr
Cap rate
9.31%
Cash-on-cash
10.77%
DSCR
1.48
1% rule
1.60%
Cash to close
$35,000
Investor read
- This is a 2-bed/2.0-bath townhouse listed at $125k.
- At list price, monthly cash flow is $314 ($4k/yr) — positive.
- The deal already cash-flows at list — no discount required.
- Meets the 1% rule at list price ($2k rent vs $125k).
- It's been on market 260 days — a 12% lower offer ($110k) is reasonable based on typical stale-listing flexibility.
- Recommended offer: $110k (12.0% below list) — sets the bar for market timing.
- In year one you build about $268 of equity ($864 loan paydown + $-596 appreciation (-0.5% local appreciation)).
- Location reads 62/100 on livability (#220 in AR) — a middle-class / working-renter tenant base. Strengths: cost of living A+, housing A+, crime B; Watch: employment D+, schools F, amenities F.
- Shirley School District (rural): math 44% / reading 42% proficiency, ranked #132 of 245 in AR (top 54%) — families likely to look elsewhere, expect single-tenant / working-renter base with shorter leases; 73% free/reduced lunch — lower-income household profile, screen leases tightly.
- Watch-outs: HOA is 20% of rent.
- Market conditions: 259 active listings in the ZIP; 1 comparable units currently listed for rent nearby; 16 units permitted in Van Buren County in 2024 (0 in 5+ unit buildings).
- Van Buren County population projected at -27% by 2050 — secular population decline; favor cash flow + early exit over multi-decade hold.
- 2 sale attempts since 14y ago; this cycle's ask has dropped $45k (26%) from the opening price — seller is motivated, your offer sets the floor, not the list.
- Current owner paid $59k; list at $125k implies a 111% gain — meaningful room to come down on a strong offer.
- At projected returns (-0.5% appreciation + 3.0% rent growth), your $35k cash investment doubles in ~7 years — after that, you're playing with house money.
- Cap rate 9.3% vs local median 5.3% in Fairfield Bay — top-decile yield for the area; either an underpriced asset or a hidden risk that comps aren't pricing in. Stress-test before assuming the spread holds.
Questions for listing agent
- It's been on market 260 days. Have you received any prior offers? Is the seller open to a 12% concession, seller financing, or rate buy-down credit?
- What does the HOA fee cover, when was the last increase, and are there any pending special assessments or reserve-fund shortfalls?
- Why hasn't it sold? Are there any deal-killer items the seller is aware of (foundation, flood, title, zoning, code violations)?
- Is there a deadline driving the sale (1031 exchange, divorce, estate, relocation)? That informs how much negotiation room exists.
- Schools are F-rated, which usually means shorter tenancies and higher turnover. Who's the typical renter profile here, and what's been the actual vacancy rate?
- What's the average days-on-market for RENTAL listings here right now (not sales)? A rising rental-DOM trend means longer vacancies and softer asking-rent achievability than the comps imply.
- What's the recent tenant-quality profile in this submarket — average credit score on applications, eviction rate, late-payment / NSF rate, and stable-employment percentage? A property-management company in the area should have these aggregated.
- How much new for-sale + rental construction is in the pipeline within 1–3 miles? Heavy new supply typically softens prices + rents 12–24 months out; constrained supply supports both.
CashFlowRE · CFR-HVH0WNF699DDA9
· Data 23 h ago
cashflowre.app · 2026-05-29