220 Aspen
Lost Bridge Village, AR 72632
$1,250,000D-
3 bd · 3.5 ba ·
3,288 sqft ·
Built 2017
· SingleFamily
· Pending
· 7 DOM
Cashflow @ list (25.0% down · 7.5%)
Estimated rent
$8,796/mo
Mortgage (P&I)
−$6,555
Tax + insurance
−$746
HOA
−$0
Vac / Maint / Mgmt
−$1,847
Net cashflow
$-352/mo
Annual
$-4,226/yr
Cap rate
5.95%
Cash-on-cash
-1.21%
DSCR
0.95
1% rule
0.70%
Cash to close
$350,000
Investor read
- This is a 3-bed/3.5-bath single-family listed at $1.25M.
- At list price, monthly cash flow is $-352 ($-4k/yr) — negative.
- To cash-flow at today's rent, offer at most $1.19M (5.0% below list).
- To meet the 1% rule (rent ≥ 1% of price), the offer needs to be $880k (29.6% below list).
- Only 7 days on market — expect competitive offers; lowballing is unlikely to land.
- Recommended offer: $880k (29.6% below list) — sets the bar for 1% rule.
- Local home prices are declining (-1.8%/yr); year-one equity from $9k of loan paydown is wiped out by about $22k of value loss. Plan a longer hold.
- Location reads 57/100 on livability (#348 in AR) — a working-class tenant base; expect higher turnover. Strengths: housing A+, crime B+, employment B; Watch: cost of living C-, amenities F, commute F.
- Eureka Springs School District (rural): math 37% / reading 46% proficiency, ranked #61 of 238 in AR (top 26%) — families likely to look elsewhere, expect single-tenant / working-renter base with shorter leases.
- Zoned schools: Eureka Springs Elem. School (math 47% / reading 42%, grade F, #143 of 454 statewide, top 36%, 227 students, 66% FRL); Eureka Springs Middle School (math 37% / reading 42%, grade F, #92 of 201 statewide, top 50%, 212 students, 64% FRL); Eureka Springs High School (math 27% / reading 52%, grade F, #48 of 292 statewide, top 19%, 222 students, 51% FRL).
- Market conditions: 202 active listings in the ZIP; 2 comparable units currently listed for rent nearby; 30 units permitted in Carroll County in 2024 (0 in 5+ unit buildings).
- Carroll County population projected at +4% by 2050 — modest demand growth; plan on rents tracking national, not racing it.
- Current owner paid $149k; list at $1.25M implies a 739% gain — meaningful room to come down on a strong offer.
- Cap rate 6.0% vs local median 4.6% in Lost Bridge Village — meaningfully above typical; check what's discounted (condition, days-on-market, listing class) to confirm the premium yield is real.
Questions for listing agent
- What do current leases actually rent for vs. the listed asking? Can we see a recent rent roll and the last 12 months of T-12 income?
- Is there a deadline driving the sale (1031 exchange, divorce, estate, relocation)? That informs how much negotiation room exists.
- Schools are F-rated, which usually means shorter tenancies and higher turnover. Who's the typical renter profile here, and what's been the actual vacancy rate?
- The area grade is low — what's the realistic commute time and amenity access for the typical tenant pool here? Any planned neighborhood developments (good or bad) we should know about?
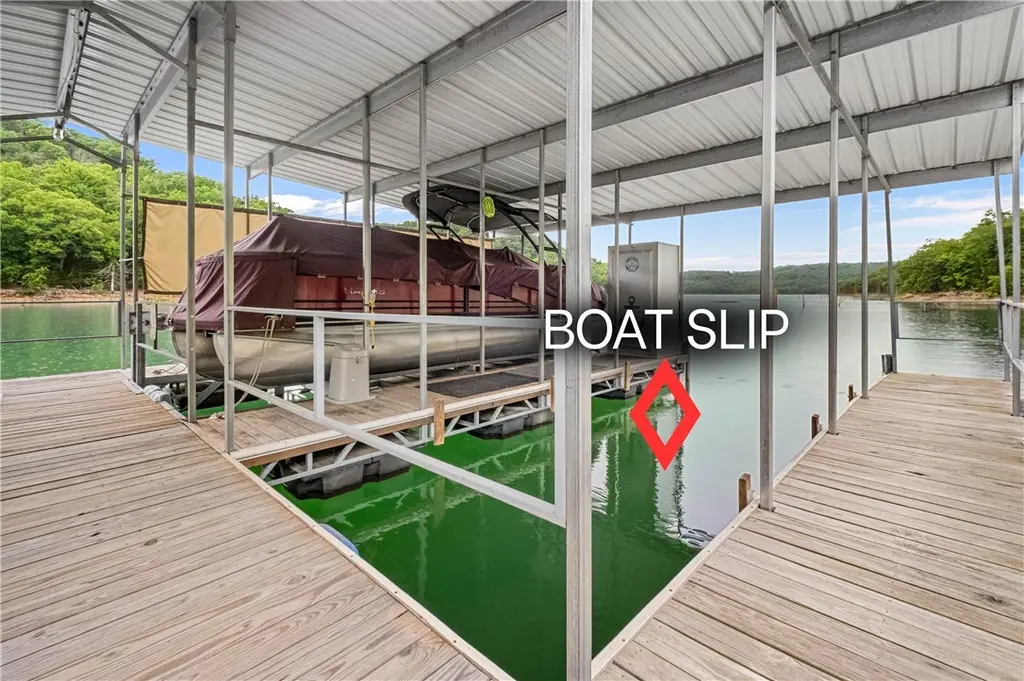
- This sits on a lake — are riparian / water-frontage rights deeded with the parcel? Any dock permits, shoreline easements, or HOA water-use restrictions?
- What's the documented flood / surge / shoreline-erosion history here (FEMA AND non-FEMA — e.g., storm surge, creek backup, septic-field saturation)?
- Any water-quality or seasonal algae-bloom issues that affect tenant satisfaction or short-term-rental demand?
- What's the average days-on-market for RENTAL listings here right now (not sales)? A rising rental-DOM trend means longer vacancies and softer asking-rent achievability than the comps imply.
CashFlowRE · CFR-HW8HGB9G0F5F6J
· Data 1 week ago
cashflowre.app · 2026-05-29