 🌊 Lakefront
220 Aspen · Lost Bridge Village, AR
Flood risk 1/10 · Minimal
- FEMA flood zone
- X (unshaded)
- Chance of flooding over 30 yrs
- 0.0%
- Est. flood insurance / yr
- $507 – $1,088
Fire risk 4/10 · Minor
- Est. fire insurance / yr
- $1,499 – $2,785
Heat risk 4/10 · Minor
- Hot days now (above 105°F)
- 7 days/yr
- Hot days in 30 yrs
- 21 days/yr
Wind risk 2/10 · Minimal
- Chance of severe wind over 30 yrs
- 2.0%
Air-quality risk 1/10 · Minimal
- Unhealthy air days now
- 0 days/yr
- Unhealthy air days in 30 yrs
- 0 days/yr
Risk factors via First Street. Map © Google.
Why this score? — see what drove the D- grade
The composite is a weighted blend of 9 inputs, each scored 0–100. Each bar is that input's sub-score; the figure is the points it added to the 100-point composite (weight × sub-score).
- Cash flow +11.8/30.0
- Appreciation +4.1/10.0
- DSCR +3.5/10.0
- Schools +3.5/10.0
- Livability +2.9/5.0
- ARV discount +2.8/15.0
- Rent growth +2.5/5.0
- Condition / age +2.5/5.0
- 1% rule +2.0/10.0
$1,250,000
🖨 Deal sheet (PDF) 📄 Offer letter ✓ Due diligence
Listing remarks
This custom-built lakefront estate offers panoramic Beaver Lake views, quality craftsmanship, and a waterfront lifestyle that's increasingly difficult to find. Located in a gated community, a concrete driveway leads all the way to the property. Whitewashed pine beams, Georgia long-leaf pine floors, a floor-to-ceiling stone fireplace, and walls of windows highlight the family room. The main level features a luxurious owner's suite, office, and half bath. Designed with entertaining in mind, the kitchen boasts granite countertops, an oversized island, and an enormous walk-in pantry. Family and guests will appreciate the walk-out lower level with two bedrooms, each with its own bath, and a bonu
Key facts
- Gated community
- Walls of windows
- Lakefront estate
Tags
Property features AI
Finance
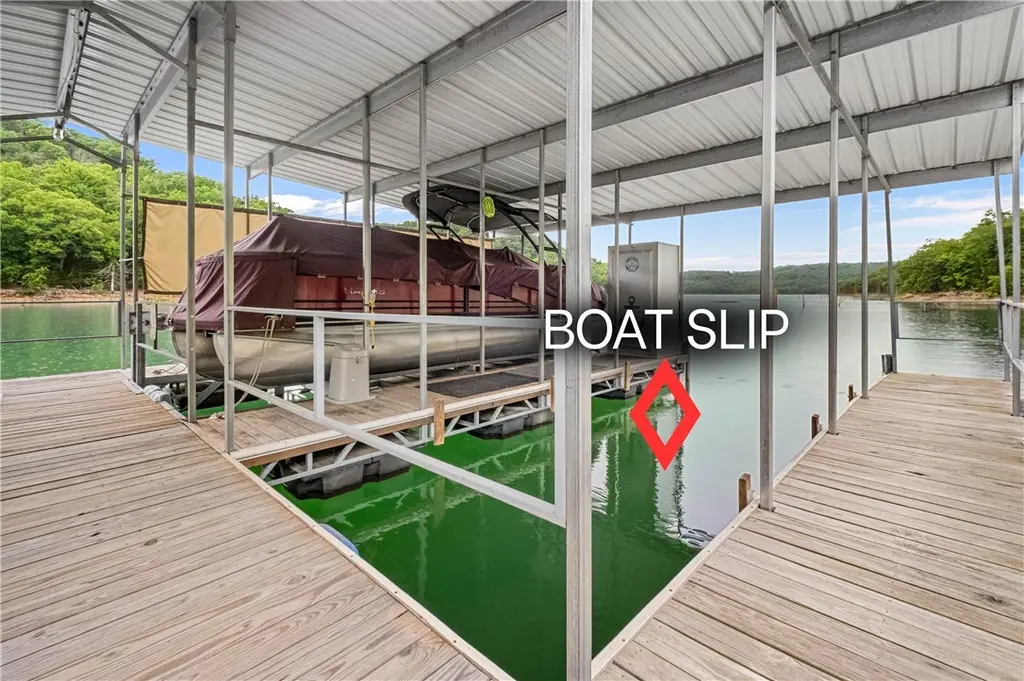
- HOA & community: Monthly association fee; Community features include biking, boat slip, trails/paths, near hospital and fire station
Exterior
- Parking: Detached garage with workshop; Garage with garage door opener; Two covered parking spaces
- Security: Security system; Storm shelter; Smoke detectors
- Utilities: Electricity available; Propane available; Well water; Septic system
- Home design: Two-story property; Slab foundation; Metal roof; Constructed of concrete and rock; Waterfront facing Beaver Lake
- Construction: Metal roof; Concrete and rock construction; Resale home (less than 25 years old)
- Exterior features: Concrete driveway; Covered patio/porch; Deck; Patio; Porch; Screened porch; Lakefront on Beaver Lake; Views; Landscaped grounds; Hardwood trees; Level to rolling terrain; Secluded, wooded setting; Resort property; Subdivision location; Outside city limits
Interior
- Kitchen: Propane cooktop; Electric oven; Microwave; Dishwasher; Disposal; Refrigerator; Counter top surfaces; Plumbed for ice maker; Exhaust fan
- Bedrooms: Bedrooms located on main and basement levels
- Flooring: Concrete floors; Tile floors; Wood floors
- Bathrooms: Three full bathrooms; One half bathroom
- Heating & cooling: Central heating; Propane heating; Radiant heating; Central air conditioning; Electric cooling; Generator
- Interior features: Attic; Built-in features; Ceiling fans; Eat-in kitchen; Granite counters; Pantry; Split bedroom layout; Storage; Walk-in closets; Window treatments; Double-pane vinyl windows; Drapes
- Laundry & utility: Washer hookup; Dryer hookup; Washer; Dryer; Electric water heater; Water heater; Utility room
Neighborhood map
What this means for you Summary
Snapshot
- This is a 3-bed/3.5-bath single-family listed at $1.25M.
Deal economics
- At list price, monthly cash flow is $-352 ($-4k/yr) — negative.
- To cash-flow at today's rent, offer at most $1.19M (5.0% below list).
- To meet the 1% rule (rent ≥ 1% of price), the offer needs to be $880k (29.6% below list).
- Recommended offer: $880k (29.6% below list) — sets the bar for 1% rule.
- Cap rate 6.0% vs local median 4.6% in Lost Bridge Village — meaningfully above typical; check what's discounted (condition, days-on-market, listing class) to confirm the premium yield is real.
Location & tenants
- Location reads 57/100 on livability (#348 in AR) — a working-class tenant base; expect higher turnover. Strengths: housing A+, crime B+, employment B; Watch: cost of living C-, amenities F, commute F.
- Eureka Springs School District (rural): math 37% / reading 46% proficiency, ranked #61 of 238 in AR (top 26%) — families likely to look elsewhere, expect single-tenant / working-renter base with shorter leases.
- Zoned schools: Eureka Springs Elem. School (math 47% / reading 42%, grade F, #143 of 454 statewide, top 36%, 227 students, 66% FRL); Eureka Springs Middle School (math 37% / reading 42%, grade F, #92 of 201 statewide, top 50%, 212 students, 64% FRL); Eureka Springs High School (math 27% / reading 52%, grade F, #48 of 292 statewide, top 19%, 222 students, 51% FRL).
- Market conditions: 202 active listings in the ZIP; 2 comparable units currently listed for rent nearby; 30 units permitted in Carroll County in 2024 (0 in 5+ unit buildings).
Forward outlook
- Local home prices are declining (-1.8%/yr); year-one equity from $9k of loan paydown is wiped out by about $22k of value loss. Plan a longer hold.
- Carroll County population projected at +4% by 2050 — modest demand growth; plan on rents tracking national, not racing it.
Negotiation context
- Only 7 days on market — expect competitive offers; lowballing is unlikely to land.
- Current owner paid $149k; list at $1.25M implies a 739% gain — meaningful room to come down on a strong offer.
Questions for the listing agent
- What do current leases actually rent for vs. the listed asking? Can we see a recent rent roll and the last 12 months of T-12 income?
- Is there a deadline driving the sale (1031 exchange, divorce, estate, relocation)? That informs how much negotiation room exists.
- Schools are F-rated, which usually means shorter tenancies and higher turnover. Who's the typical renter profile here, and what's been the actual vacancy rate?
- The area grade is low — what's the realistic commute time and amenity access for the typical tenant pool here? Any planned neighborhood developments (good or bad) we should know about?
- This sits on a lake — are riparian / water-frontage rights deeded with the parcel? Any dock permits, shoreline easements, or HOA water-use restrictions?
- What's the documented flood / surge / shoreline-erosion history here (FEMA AND non-FEMA — e.g., storm surge, creek backup, septic-field saturation)?
- Any water-quality or seasonal algae-bloom issues that affect tenant satisfaction or short-term-rental demand?
- What's the average days-on-market for RENTAL listings here right now (not sales)? A rising rental-DOM trend means longer vacancies and softer asking-rent achievability than the comps imply.
- What's the recent tenant-quality profile in this submarket — average credit score on applications, eviction rate, late-payment / NSF rate, and stable-employment percentage? A property-management company in the area should have these aggregated.
- How much new for-sale + rental construction is in the pipeline within 1–3 miles? Heavy new supply typically softens prices + rents 12–24 months out; constrained supply supports both.
Investment metrics
- 1% rule
- 0.70% ✗
- Cap rate
- 5.95%
- Cash-on-cash
- -1.21%
- DSCR
- 0.95
- GRM
- 11.8
CMA / ARV
- ARV (on-the-fly)
- $1,131,894
- Comps found
- 2
Show comp detail 2 sales within ~0.75 mi
| Address | Dist | Beds/Ba | Sqft | Sold | Price | $/sf | Match |
|---|---|---|---|---|---|---|---|
| 50 County Road 1526 | 0.39mi | 3/3.5 | 3,328 (+1%) | 19mo | $850,000 | $255 | 64 |
| 2127 Mundell Rd | 1.33mi | 3/3.0 | 3,120 (-5%) | 21mo | $690,000 | $221 | 37 |
Match score weights: distance 35% · size 25% · config 20% · recency 20%. Top-matched comps best support the ARV.
Projected returns pro-forma
-1.79% appreciation · 3.0% rent growth · sell at horizon
- IRR
- -11.4%
- Equity multiple
- 0.54×
- Total profit
- $-161,108
- Equity at exit
- $255,067
- IRR
- -4.0%
- Equity multiple
- 0.67×
- Total profit
- $-113,758
- Equity at exit
- $229,821
Cash invested: $350,000 (down + closing). Projections, not guarantees.
Landlord ↔ Tenant lean methodology
- Overall (STATE)
- 92 Strongly Landlord-Friendly
- State Arkansas
- 92 Strongly Landlord-Friendly · R+14
- County
- — inherits STATE
- City
- — inherits STATE
ZIP-level market 72632
- Home prices YoY
- -0.6%
- Active inventory
- 202
- Price-to-rent
- 11.8×
Monthly cashflow live
- Estimated rent
- $8,796 medium interval (Pro) →
- Mortgage (P&I)
- −$6,555
- Tax from tax record
- −$225 /mo · $2,703/yr
- Insurance
- −$521
- HOA
- −$0
- Vacancy / Maint / Mgmt
- −$1,847
- Net cashflow
- $-352
Break-even live
Sensitivity live
| Price | -10% $355 | -5% $2 | +0% $-352 | +5% $-706 | +10% $-2,553 |
|---|---|---|---|---|---|
| Rent | -10% $-1,047 | -5% $-700 | +0% $-352 | +5% $-5 | +10% $343 |
| Rate | -1.0pp $277 | -0.5pp $-34 | base $-352 | +0.5pp $-676 | +1.0pp $-1,006 |
UW: 25.0% down · 7.5% · 30yr · 1.5% tax · 5.0% vac · 8.0% maint · 8.0% mgmt
Financing live
Cash to close
- Down payment
- $312,500
- Closing costs
- $37,500
- Reserves months
- —
- Total cash needed
- —
Loan-product check · same deal, 3 products live
Conventional
25% down · 7.5% · 30yr
- Down + closing
- —
- Monthly P&I
- —
- Monthly cashflow
- —
- DSCR
- —
- Eligible?
- —
Personal DTI + credit; lowest rate.
DSCR
20% down · 8.5% · 30yr
- Down + closing
- —
- Monthly P&I
- —
- Monthly cashflow
- —
- DSCR
- —
- Eligible?
- —
No personal income docs; deal must DSCR.
Hard money
10% down · 12.0% · 12mo
- Down + closing
- —
- Monthly P&I
- —
- Monthly cashflow
- —
- DSCR
- —
- Eligible?
- —
Short-term bridge; refi at stabilization.
Rent comps 2 comps
| Address | Beds | Baths | Sqft | Rent | $/sqft | DOM | Units | Dist |
|---|---|---|---|---|---|---|---|---|
| 814 County Road 1524 Unit 1340101P Eureka Springs, AR | 4.0 | 3.5 | 3056 | $8,799 | $2.88 | 46d | 1 | 0.18mi |
| 366 Lakeside Rd Unit 1221805P Eureka Springs, AR | 4.0 | 3.0 | 3358 | $8,777 | $2.61 | 23d | 1 | 1.33mi |
Listing history 6 events
-
2026-06-13statusdays on market $1,250,000 Pending 7 DOM
-
2026-06-10days on market $1,250,000 Active 5 DOM
-
2026-06-09days on market $1,250,000 Active 4 DOM
-
2026-06-08days on market $1,250,000 Active 3 DOM
-
2026-06-07remarks 699-char remark
-
2026-06-07$1,250,000 Active 2 DOM
ⓘ Source: listings_history table (triggers on properties + properties_extension) + one-shot
backfill from property_details.listing_events for pre-trigger history.
Tax reassessment forecast AR · Resets to sale price
- Current annual tax
- $2,703 · $225/mo
- Projected year-2 tax
- $8,000 · $667/mo
- Expected delta
- +$5,297/yr (+$441/mo · 196.0%)
ⓘ Screening estimate from a state-policy table — verify with the county assessor before closing.
Climate risk First Street
- Flood 1/10 Low FEMA zone X (unshaded) · 0% chance over 30 yrs
- Wildfire 4/10 Moderate
- Heat 4/10 Moderate 7 d/yr ≥105°F today · 21 d/yr by 30 yrs out
- Wind 2/10 Low 2% chance of damaging wind over 30 yrs
- Air quality 1/10 Low 0 unhealthy d/yr today · 0 by 30 yrs out
Nearby sold comps map
Loading sold comps map…
Walkable amenities ~0.75 mi
Loading nearby amenities…
Taxation est. · year 1
- Rental income
- $105,555
- − Mortgage interest
- −$70,019
- − Property taxes
- −$2,703
- − Insurance
- −$6,250
- − Repairs & maintenance
- −$8,444
- − Management
- −$8,444
- − Depreciation
- −$36,364
- Taxable loss
- −$26,670
- Est. tax savings @ 24.0%
- +$6,401
- After-tax cash flow
- $2,174/yr
For passive investors: Depreciation is non-cash, so a rental often shows a tax loss while cash-flowing — sheltering income. Rental losses are passive: they offset passive income freely, and up to $25,000/yr can offset ordinary (W-2) income if you actively participate and your MAGI is under $100k (phasing out to $0 by $150k); unused losses carry forward. On sale, claimed depreciation is recaptured at up to 25%, and gains may owe capital-gains tax (a 1031 exchange can defer both). Figures are a year-1 estimate at your 24.0% rate — not tax advice; consult a CPA.
Schools (NCES district)
- District
- Eureka Springs School District
- NCES district ID
- 0505970
- Math proficiency
- 37% ▼ -23.00%
- Reading proficiency
- 46% ▼ -9.00%
- Median HH income
- $37,912
- Composite
- 34.55/100
- National rank
- #5171
- State rank
- #61 of 238 in AR
Livability — Lost Bridge Village
- Score
- 57/100
- State rank
- #348
- US rank
- #21912
Category grades
Schools grade is shown separately in the Schools card above.
Census & demographics
- Population (ZIP)
- 4,550
Population outlook (Carroll County) Hauer SSP2
- Today (2025)
- 28,014 people
- By 2030
- 28,006 · +-0.0%
- By 2040
- 28,242 · +0.8%
- By 2050
- 29,169 · +4.1%
- By 2075
- 33,935 · +21.1%
- By 2100
- 39,497 · +41.0%
Race, ethnicity, and origin ACS 2023
- Neighborhood character
- Predominantly White (86%)
- Race & ethnicity
- White 86% Two or more races 9% Hispanic / Latino 3% Native American 2%
- Common ancestry
- Italian 3% Slovak 3% Serbian 2%
- Foreign-born
- 2% · Canada
- Languages at home
- 98% English-only · Spanish 1% German/W. Germanic 1%
Political lean MEDSL · Carroll
- 2024 margin
- Solid R (+31.7) · D 33.0% · R 64.7% · Other 2.2%
- 2008→2024 swing
- -13.6pp toward R · 2008: -18.1pp · 2024: -31.7pp
- All cycles
- 2024: R+31.7 2020: R+28.8 2016: R+32.3 2012: R+23.9 2008: R+18.1
Not yet ingested
- Civics
- —
Market trends
- HPI YoY
- ▼ -1.79%
- Current HPI
- 284.3048
- Rent YoY
- —
- Metro
- —
- State GDP YoY
- ▲ 3.80%
- F500 in state
- 10
Industry mix (Fortune 500 HQ in AR)
| Industry | F500 HQs | Revenue |
|---|---|---|
| Retail | 1 | $681B |
|
||
| Food / Agriculture | 1 | $53B |
|
||
| Retail / Energy | 1 | $22B |
|
||
| Transportation / Logistics | 1 | $12B |
|
||
| Energy | 1 | $4B |
|
||
Price history
+738.9% since first listed2 events — show timeline
- 2026-06-05 Listed $1,250,000 NWARMLS
- 2012-01-04 Sold (Public Records) $149,000 Public Records
Property tax history
+13.1%/yrLatest (2025): $2,703 · +8.4% YoY. Source: county tax records.
Cash-flow waterfall
monthlySold comps — $/sqft
last 12 mo · ≤1 miLoading sold comps…