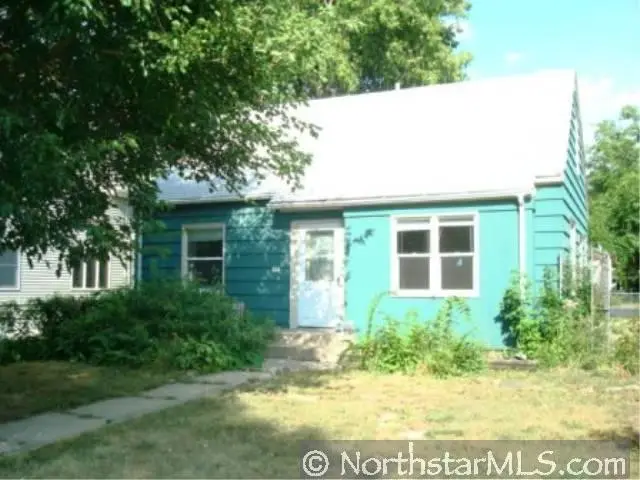
3214 Dupont Ave N
Minneapolis, MN 55412
$239,900D
3 bd · 1.0 ba ·
972 sqft ·
Built 1951
· SingleFamily
· Pending
· 18 DOM
Cashflow @ list (25.0% down · 7.5%)
Estimated rent
$1,742/mo
Mortgage (P&I)
−$1,258
Tax + insurance
−$297
HOA
−$0
Vac / Maint / Mgmt
−$366
Net cashflow
$-179/mo
Annual
$-2,151/yr
Cap rate
5.40%
Cash-on-cash
-3.20%
DSCR
0.86
1% rule
0.73%
Cash to close
$67,172
Investor read
- This is a 3-bed/1.0-bath single-family listed at $240k.
- At list price, monthly cash flow is $-179 ($-2k/yr) — negative.
- To cash-flow at today's rent, offer at most $208k (13.2% below list).
- To meet the 1% rule (rent ≥ 1% of price), the offer needs to be $174k (27.4% below list).
- It's been on market 18 days — a 2% lower offer ($236k) is reasonable based on typical stale-listing flexibility.
- Recommended offer: $174k (27.4% below list) — sets the bar for 1% rule.
- Local home prices are declining (-3.0%/yr); year-one equity from $2k of loan paydown is wiped out by about $7k of value loss. Plan a longer hold.
- Location reads 78/100 on livability (#110 in MN, #2,525 nationally) — a middle-class / working-renter tenant base. Strengths: amenities A+, commute A+, housing A+; Watch: cost of living C-, crime F.
- Minneapolis Public School District (urban): math 35% / reading 46% proficiency, ranked #217 of 301 in MN (top 72%) — families likely to look elsewhere, expect single-tenant / working-renter base with shorter leases.
- Zoned schools: Nellie Stone Johnson Elementary (math 2% / reading 17%, grade F, #829 of 857 statewide, top 98%, 201 students, 96% FRL); Franklin Middle (math 2% / reading 8%, grade F, #255 of 258 statewide, top 100%, 287 students, 89% FRL); Henry High (reading 70%, 858 students, 80% FRL) — zoned schools average 88% FRL vs 58% district-wide (30 pts higher); higher-poverty schools than district average — tighter screening recommended.
- Zoned-school proficiency averages 7% at this address vs 40% district-wide (-33 pts) — the specific schools serving this property underperform the Minneapolis Public School District average; the district grade overstates school quality for this exact location.
- Watch-outs: built in 1951 — expect roof / HVAC / electrical / plumbing capex.
- Market conditions: Rents rising fast (+6.3%/yr); 168 active listings in the ZIP; 28 comparable units currently listed for rent nearby; rentals at typical pace (median 17d on market — plan ~3-4 weeks tenant-placement turnaround); 4,651 units permitted in Hennepin County in 2024 (2,443 in 5+ unit buildings).
- Hennepin County population projected at +30% by 2050 — long-run rental-demand tailwind backs the buy-and-hold thesis.
- 9 sale attempts since 24y ago with the ask held roughly flat each time — persistent listings suggest the price (not the market) is what's stuck; bring a comps-based counter.
- Current owner paid $500; list at $240k implies a 47880% gain — meaningful room to come down on a strong offer.
- Cap rate 5.4% vs local median 3.1% in Minneapolis — top-decile yield for the area; either an underpriced asset or a hidden risk that comps aren't pricing in. Stress-test before assuming the spread holds.
- This rent runs 30% of the median local income ($69k/yr) — at the standard rent-burdened threshold; future hikes will face affordability resistance.
Questions for listing agent
- What do current leases actually rent for vs. the listed asking? Can we see a recent rent roll and the last 12 months of T-12 income?
- Built in 1951 — when were the roof, HVAC, electrical panel, plumbing, and water heater last replaced?
- Is there a deadline driving the sale (1031 exchange, divorce, estate, relocation)? That informs how much negotiation room exists.
- Crime grade is F in this area — have there been break-ins, vandalism, or insurance claims at this property in the last 3 years? What carrier currently insures it and at what premium?
- The area grade is low — what's the realistic commute time and amenity access for the typical tenant pool here? Any planned neighborhood developments (good or bad) we should know about?
- What's the average days-on-market for RENTAL listings here right now (not sales)? A rising rental-DOM trend means longer vacancies and softer asking-rent achievability than the comps imply.
- What's the recent tenant-quality profile in this submarket — average credit score on applications, eviction rate, late-payment / NSF rate, and stable-employment percentage? A property-management company in the area should have these aggregated.
- How much new for-sale + rental construction is in the pipeline within 1–3 miles? Heavy new supply typically softens prices + rents 12–24 months out; constrained supply supports both.
CashFlowRE · CFR-HYTR91EH1N6S2R
· Data 5 days ago
cashflowre.app · 2026-05-29