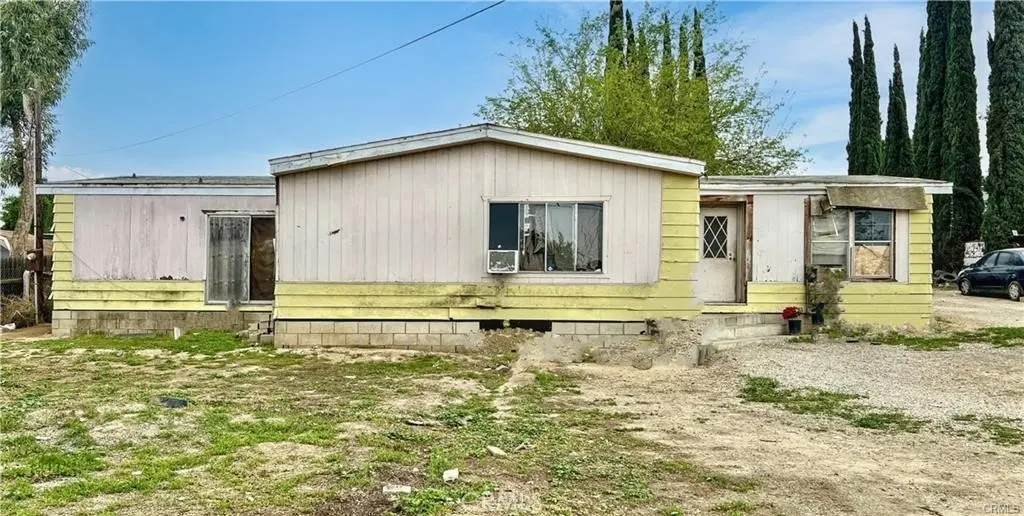
20785 Burns St
Mead Valley, CA 92570
$390,000D-
3 bd · 2.0 ba ·
1,680 sqft ·
Built 1980
· Manufactured
· Active
· 26 DOM
Cashflow @ list (25.0% down · 7.5%)
Estimated rent
$3,101/mo
Mortgage (P&I)
−$2,045
Tax + insurance
−$234
HOA
−$0
Vac / Maint / Mgmt
−$651
Net cashflow
$171/mo
Annual
$2,049/yr
Cap rate
6.82%
Cash-on-cash
1.88%
DSCR
1.08
1% rule
0.80%
Cash to close
$109,200
Investor read
- This is a 3-bed/2.0-bath manufactured listed at $390k.
- At list price, monthly cash flow is $171 ($2k/yr) — positive.
- The deal already cash-flows at list — no discount required.
- To meet the 1% rule (rent ≥ 1% of price), the offer needs to be $310k (20.5% below list).
- It's been on market 26 days — a 2% lower offer ($384k) is reasonable based on typical stale-listing flexibility.
- Recommended offer: $310k (20.5% below list) — sets the bar for 1% rule.
- Local home prices are declining (-3.0%/yr); year-one equity from $3k of loan paydown is wiped out by about $12k of value loss. Plan a longer hold.
- Location reads 41/100 on livability (#1,381 in CA) — a working-class tenant base; expect higher turnover. Strengths: housing A+; Watch: schools F, crime F, amenities F.
- Val Verde Unified (suburban): math 28% / reading 44% proficiency, ranked #820 of 1,400 in CA (top 59%) — families likely to look elsewhere, expect single-tenant / working-renter base with shorter leases; 66% free/reduced lunch — lower-income household profile, screen leases tightly.
- Market conditions: 205 active listings in the ZIP; solid renter incomes; 9,195 units permitted in Riverside County in 2024 (1,512 in 5+ unit buildings).
- Riverside County population projected at +22% by 2050 — long-run rental-demand tailwind backs the buy-and-hold thesis.
- 5 sale attempts; this cycle's ask has dropped $160k (29%) from the opening price — seller is motivated, your offer sets the floor, not the list.
- Current owner paid $42k; list at $390k implies a 829% gain — meaningful room to come down on a strong offer.
- Climate carrying-cost: severe wildfire risk; extreme-heat days projected 7→20/yr by 2055 (HVAC capex compounding) — expect insurance premiums to compound above CPI over the hold.
- Cap rate 6.8% vs local median 3.3% in Mead Valley — top-decile yield for the area; either an underpriced asset or a hidden risk that comps aren't pricing in. Stress-test before assuming the spread holds.
- At $3,101/mo this rent would consume 47% of the median local household income ($79k/yr) (locally 1140% of renters already pay >50% of income on rent) — very limited rent-growth headroom before tenants either downsize or default.
Questions for listing agent
- Is there a deadline driving the sale (1031 exchange, divorce, estate, relocation)? That informs how much negotiation room exists.
- Schools are F-rated, which usually means shorter tenancies and higher turnover. Who's the typical renter profile here, and what's been the actual vacancy rate?
- Crime grade is F in this area — have there been break-ins, vandalism, or insurance claims at this property in the last 3 years? What carrier currently insures it and at what premium?
- The area grade is low — what's the realistic commute time and amenity access for the typical tenant pool here? Any planned neighborhood developments (good or bad) we should know about?
- What's the average days-on-market for RENTAL listings here right now (not sales)? A rising rental-DOM trend means longer vacancies and softer asking-rent achievability than the comps imply.
- What's the recent tenant-quality profile in this submarket — average credit score on applications, eviction rate, late-payment / NSF rate, and stable-employment percentage? A property-management company in the area should have these aggregated.
- How much new for-sale + rental construction is in the pipeline within 1–3 miles? Heavy new supply typically softens prices + rents 12–24 months out; constrained supply supports both.
CashFlowRE · CFR-HZCWM45Z410D8A
· Data 2 days ago
cashflowre.app · 2026-05-29