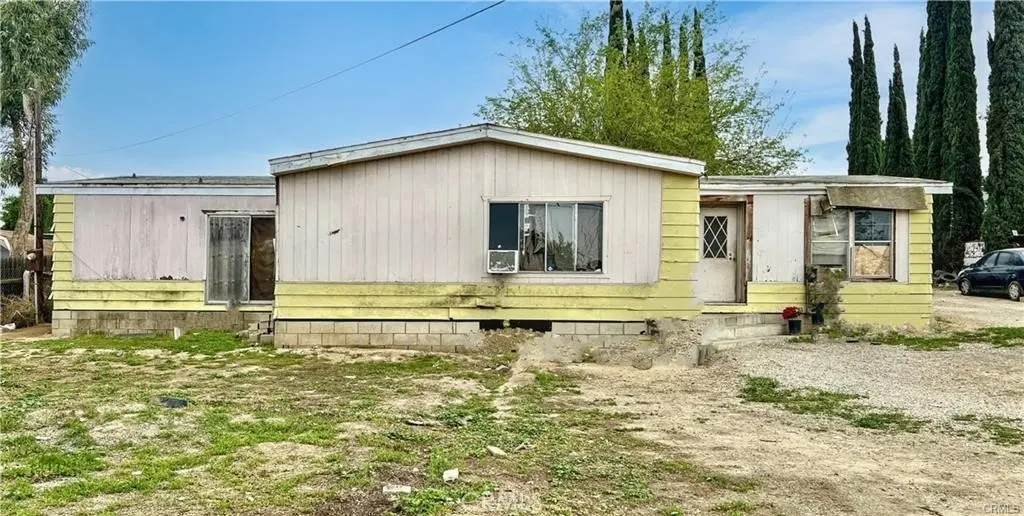
20785 Burns St · Mead Valley, CA
Flood risk 4/10 · Minor
- FEMA flood zone
- X (unshaded)
- Chance of flooding over 30 yrs
- 0.2%
- Est. flood insurance / yr
- $507 – $1,088
Fire risk 10/10 · Severe
- Est. fire insurance / yr
- $659 – $1,223
Heat risk 6/10 · Moderate
- Hot days now (above 102°F)
- 7 days/yr
- Hot days in 30 yrs
- 20 days/yr
Wind risk 1/10 · Minimal
- Chance of severe wind over 30 yrs
- —
Air-quality risk 9/10 · Severe
- Unhealthy air days now
- 19 days/yr
- Unhealthy air days in 30 yrs
- 23 days/yr
Risk factors via First Street. Map © Google.
Why this score? — see what drove the D- grade
The composite is a weighted blend of 9 inputs, each scored 0–100. Each bar is that input's sub-score; the figure is the points it added to the 100-point composite (weight × sub-score).
- Cash flow +15.7/30.0
- ARV discount +4.9/15.0
- DSCR +4.8/10.0
- Schools +3.4/10.0
- 1% rule +3.0/10.0
- Rent growth +2.5/5.0
- Condition / age +2.5/5.0
- Livability +2.1/5.0
- Appreciation +0.0/10.0
$390,000
🖨 Deal sheet 📄 Offer letter ✓ Due diligence
Listing remarks MLS
Don’t miss this opportunity! This 8 bed, 3 bath manufactured home sits on a spacious lot over 20,000 sqft — no land lease! Bring your RV, toys, or even your animals — this Rural Residential-zoned property allows for a variety of uses including small-scale farming, livestock, home occupations, and more. Whether you're looking to start a garden, raise animals, or just enjoy extra space, this versatile property has endless potential. Conveniently located just minutes from the 15, 91, and 215 freeways!
Key facts
- Small scale farming
- Home occupations
- Spacious lot
Tags
Neighborhood map
What this means for you Summary
Snapshot
- This is a 3-bed/2.0-bath manufactured listed at $390k.
Deal economics
- At list price, monthly cash flow is $171 ($2k/yr) — positive.
- The deal already cash-flows at list — no discount required.
- To meet the 1% rule (rent ≥ 1% of price), the offer needs to be $310k (20.5% below list).
- Recommended offer: $310k (20.5% below list) — sets the bar for 1% rule.
- Cap rate 6.8% vs local median 3.3% in Mead Valley — top-decile yield for the area; either an underpriced asset or a hidden risk that comps aren't pricing in. Stress-test before assuming the spread holds.
Location & tenants
- Location reads 41/100 on livability (#1,381 in CA) — a working-class tenant base; expect higher turnover. Strengths: housing A+; Watch: schools F, crime F, amenities F.
- Val Verde Unified (suburban): math 28% / reading 44% proficiency, ranked #820 of 1,400 in CA (top 59%) — families likely to look elsewhere, expect single-tenant / working-renter base with shorter leases; 66% free/reduced lunch — lower-income household profile, screen leases tightly.
- Market conditions: 205 active listings in the ZIP; solid renter incomes; 9,195 units permitted in Riverside County in 2024 (1,512 in 5+ unit buildings).
- At $3,101/mo this rent would consume 47% of the median local household income ($79k/yr) (locally 1140% of renters already pay >50% of income on rent) — very limited rent-growth headroom before tenants either downsize or default.
Forward outlook
- Local home prices are declining (-3.0%/yr); year-one equity from $3k of loan paydown is wiped out by about $12k of value loss. Plan a longer hold.
- Riverside County population projected at +22% by 2050 — long-run rental-demand tailwind backs the buy-and-hold thesis.
Negotiation context
- It's been on market 26 days — a 2% lower offer ($384k) is reasonable based on typical stale-listing flexibility.
- 5 sale attempts; this cycle's ask has dropped $160k (29%) from the opening price — seller is motivated, your offer sets the floor, not the list.
- Current owner paid $42k; list at $390k implies a 829% gain — meaningful room to come down on a strong offer.
Risks & watch-outs
- Climate carrying-cost: severe wildfire risk; extreme-heat days projected 7→20/yr by 2055 (HVAC capex compounding) — expect insurance premiums to compound above CPI over the hold.
Questions for the listing agent
- Is there a deadline driving the sale (1031 exchange, divorce, estate, relocation)? That informs how much negotiation room exists.
- Schools are F-rated, which usually means shorter tenancies and higher turnover. Who's the typical renter profile here, and what's been the actual vacancy rate?
- Crime grade is F in this area — have there been break-ins, vandalism, or insurance claims at this property in the last 3 years? What carrier currently insures it and at what premium?
- The area grade is low — what's the realistic commute time and amenity access for the typical tenant pool here? Any planned neighborhood developments (good or bad) we should know about?
- What's the average days-on-market for RENTAL listings here right now (not sales)? A rising rental-DOM trend means longer vacancies and softer asking-rent achievability than the comps imply.
- What's the recent tenant-quality profile in this submarket — average credit score on applications, eviction rate, late-payment / NSF rate, and stable-employment percentage? A property-management company in the area should have these aggregated.
- How much new for-sale + rental construction is in the pipeline within 1–3 miles? Heavy new supply typically softens prices + rents 12–24 months out; constrained supply supports both.
Investment metrics
- 1% rule
- 0.80% ✗
- Cap rate
- 6.82%
- Cash-on-cash
- 1.88%
- DSCR
- 1.08
- GRM
- 10.5
CMA / ARV
- ARV (median comp)
- $369,032
- List price
- $390,000
- Delta
- 49.04%
- Verdict
- OVERPRICED
- Comps
- 3 within 1.0 mi
Show comp detail 4 sales within ~0.75 mi
| Address | Dist | Beds/Ba | Sqft | Sold | Price | $/sf | Match |
|---|---|---|---|---|---|---|---|
| 20748 Martin St | 0.30mi | 3/2.0 | 1,716 (+2%) | 8mo | $331,000 | $193 | 76 |
| 20540 Verta | 0.66mi | 3/2.0 | 1,440 (-14%) | 0mo | $315,000 | $219 | 45 |
| 18693 Brown St | 0.63mi | 2/2.0 (-1) | 1,800 (+7%) | 19mo | $450,000 | $250 | 38 |
| 20880 Myron St | 0.55mi | 3/2.0 | 1,456 (-13%) | 23mo | $420,000 | $288 | 33 |
Match score weights: distance 35% · size 25% · config 20% · recency 20%. Top-matched comps best support the ARV.
Projected returns pro-forma
-3.0% appreciation · 3.0% rent growth · sell at horizon
- IRR
- -13.4%
- Equity multiple
- 0.52×
- Total profit
- $-52,533
- Equity at exit
- $58,150
- IRR
- -4.5%
- Equity multiple
- 0.70×
- Total profit
- $-32,594
- Equity at exit
- $33,720
Cash invested: $109,200 (down + closing). Projections, not guarantees.
Landlord ↔ Tenant lean methodology
- Overall (STATE)
- 18 Strongly Tenant-Friendly
- State California
- 18 Strongly Tenant-Friendly · D+13
- County
- — inherits STATE
- City
- — inherits STATE
ZIP-level market 92570
- Home prices YoY
- -11.8%
- Active inventory
- 205
- Price-to-rent
- 10.5×
Monthly cashflow live
- Estimated rent
- $3,101 medium interval (Pro) →
- Mortgage (P&I)
- −$2,045
- Tax from tax record
- −$71 /mo · $853/yr
- Insurance
- −$162
- HOA
- −$0
- Vacancy / Maint / Mgmt
- −$651
- Net cashflow
- $171
Break-even live
UW: 25.0% down · 7.5% · 30yr · 1.5% tax · 5.0% vac · 8.0% maint · 8.0% mgmt
Financing live
Cash to close
- Down payment
- $97,500
- Closing costs
- $11,700
- Reserves months
- —
- Total cash needed
- —
Loan-product check · same deal, 3 products live
Conventional
25% down · 7.5% · 30yr
- Down + closing
- —
- Monthly P&I
- —
- Monthly cashflow
- —
- DSCR
- —
- Eligible?
- —
Personal DTI + credit; lowest rate.
DSCR
20% down · 8.5% · 30yr
- Down + closing
- —
- Monthly P&I
- —
- Monthly cashflow
- —
- DSCR
- —
- Eligible?
- —
No personal income docs; deal must DSCR.
Hard money
10% down · 12.0% · 12mo
- Down + closing
- —
- Monthly P&I
- —
- Monthly cashflow
- —
- DSCR
- —
- Eligible?
- —
Short-term bridge; refi at stabilization.
Listing history 21 events
-
2026-06-18days on market $390,000 Active 26 DOM
-
2026-06-17days on market $390,000 Active 25 DOM
-
2026-06-16days on market $390,000 Active 24 DOM
-
2026-06-15days on market $390,000 Active 23 DOM
-
2026-06-13days on market $390,000 Active 21 DOM
-
2026-06-09days on market $390,000 Active 17 DOM
-
2026-06-08days on market $390,000 Active 16 DOM
-
2026-06-07days on market $390,000 Active 15 DOM
-
2026-06-04days on market $390,000 Active 12 DOM
-
2026-06-03days on market $390,000 Active 11 DOM
-
2026-06-02days on market $390,000 Active 10 DOM
-
2026-06-01days on market $390,000 Active 9 DOM
-
2026-05-31days on market $390,000 Active 8 DOM
-
2025-11-20$550,000 Active 521-char remark
Show marketing remark (521 chars)
Don’t miss this opportunity! This 8 bed, 3 bath manufactured home sits on a spacious lot over 20,000 sqft — no land lease! Bring your RV, toys, or even your animals — this Rural Residential-zoned property allows for a variety of uses including small-scale farming, livestock, home occupations, and more. Whether you're looking to start a garden, raise animals, or just enjoy extra space, this versatile property has endless potential. Conveniently located just minutes from the 15, 91, and 215 freeways!
-
2025-10-17status Active
-
2025-10-16status Active
-
2025-10-16historical
-
2025-10-12status Active
-
2025-04-17$550,000 Active
-
2012-07-05soldstatus $42,000
-
1990-09-06soldstatus $39,536
ⓘ Source: listings_history table (triggers on properties + properties_extension) + one-shot
backfill from property_details.listing_events for pre-trigger history.
Tax reassessment forecast CA · Resets to sale price
- Current annual tax
- $853 · $71/mo
- Projected year-2 tax
- $2,964 · $247/mo
- Expected delta
- +$2,111/yr (+$176/mo · 247.6%)
ⓘ Screening estimate from a state-policy table — verify with the county assessor before closing.
Climate risk First Street
- Flood 4/10 Moderate FEMA zone X (unshaded) · 20% chance over 30 yrs
- Wildfire 10/10 Extreme
- Heat 6/10 Major 7 d/yr ≥102°F today · 20 d/yr by 30 yrs out
- Wind 1/10 Low
- Air quality 9/10 Extreme 19 unhealthy d/yr today · 23 by 30 yrs out
Nearby sold comps map
Loading sold comps map…
Walkable amenities ~0.75 mi
Loading nearby amenities…
Taxation est. · year 1
- Rental income
- $37,207
- − Mortgage interest
- −$21,846
- − Property taxes
- −$853
- − Insurance
- −$1,950
- − Repairs & maintenance
- −$2,977
- − Management
- −$2,977
- − Depreciation
- −$11,345
- Taxable loss
- −$4,740
- Est. tax savings @ 24.0%
- +$1,138
- After-tax cash flow
- $3,186/yr
For passive investors: Depreciation is non-cash, so a rental often shows a tax loss while cash-flowing — sheltering income. Rental losses are passive: they offset passive income freely, and up to $25,000/yr can offset ordinary (W-2) income if you actively participate and your MAGI is under $100k (phasing out to $0 by $150k); unused losses carry forward. On sale, claimed depreciation is recaptured at up to 25%, and gains may owe capital-gains tax (a 1031 exchange can defer both). Figures are a year-1 estimate at your 24.0% rate — not tax advice; consult a CPA.
Schools (NCES district)
- District
- Val Verde Unified
- NCES district ID
- 0691135
- Math proficiency
- 28% ▲ 1.00%
- Reading proficiency
- 44% ▲ 2.00%
- Median HH income
- $57,468
- Composite
- 34.45/100
- National rank
- #10154
- State rank
- #820 of 1400 in CA
Livability — Mead Valley
- Score
- 41/100
- State rank
- #1381
- US rank
- #27206
Category grades
Schools grade is shown separately in the Schools card above.
Census & demographics
- Census place
- Mead Valley, CA
- County
- Riverside County · 2,287,001 people
- Metro
- Riverside-San Bernardino-Ontario, CA
- Population (ZIP)
- 58,082
- Household income
- $79,393
- Rent vs Own
- Severe rent burden
- 1140.0
Population outlook (Riverside County) Hauer SSP2
- Today (2025)
- 2,664,475 people
- By 2030
- 2,802,692 · +5.2%
- By 2040
- 3,050,904 · +14.5%
- By 2050
- 3,256,783 · +22.2%
- By 2075
- 3,655,058 · +37.2%
- By 2100
- 3,766,594 · +41.4%
Race, ethnicity, and origin ACS 2023
- Neighborhood character
- Predominantly Hispanic (77%)
- Race & ethnicity
- Hispanic / Latino 77% Two or more races 15% White 14% Black 4% Asian 2% Native American 1%
- Hispanic origin (detail)
- Mexican 68%
- Common ancestry
- Lithuanian 1% Italian 0%
- Foreign-born
- 32% · Canada
- Languages at home
- 33% English-only · Spanish 65% Tagalog/Filipino 1% Other Indo-European 1%
Political lean MEDSL · Riverside
- 2024 margin
- Toss-up / Even · D 48.0% · R 49.3% · Other 2.6%
- 2008→2024 swing
- -3.6pp toward R · 2008: 2.3pp · 2024: -1.3pp
- All cycles
- 2024: R+1.3 2020: D+8.0 2016: D+4.3 2012: R+0.4 2008: D+2.3
Not yet ingested
- Civics
- —
Market trends
- HPI YoY
- ▼ -61.72%
- Current HPI
- 460.1716
- Rent YoY
- —
- Metro
- Riverside-San Bernardino-Ontario, CA
- State GDP YoY
- ▲ 3.21%
- F500 in state
- 116
Industry mix (Fortune 500 HQ in CA)
| Industry | F500 HQs | Revenue |
|---|---|---|
| Technology | 27 | $1,492B |
|
||
| Financial Services | 3 | $174B |
|
||
| Retail | 3 | $44B |
|
||
| Insurance | 3 | $26B |
|
||
| Media / Entertainment | 2 | $115B |
|
||
| Pharmaceuticals / Biotech | 2 | $62B |
|
||
Price history
+1291.1% since first listed8 events — show timeline
- 2025-11-20 Listed $550,000 CRMLS
- 2025-10-17 Relisted — CRMLS
- 2025-10-16 Relisted — CRMLS
- 2025-10-16 Listing Removed — CRMLS
- 2025-10-12 Relisted — CRMLS
- 2025-04-17 Listed $550,000 CRMLS
- 2012-07-05 Sold (Public Records) $42,000 Public Records
- 1990-09-06 Sold (Public Records) $39,536 Public Records
Property tax history
-1.6%/yrLatest (2025): $853 · +2.4% YoY. Source: county tax records.
Cash-flow waterfall
monthlySold comps — $/sqft
last 12 mo · ≤1 miLoading sold comps…