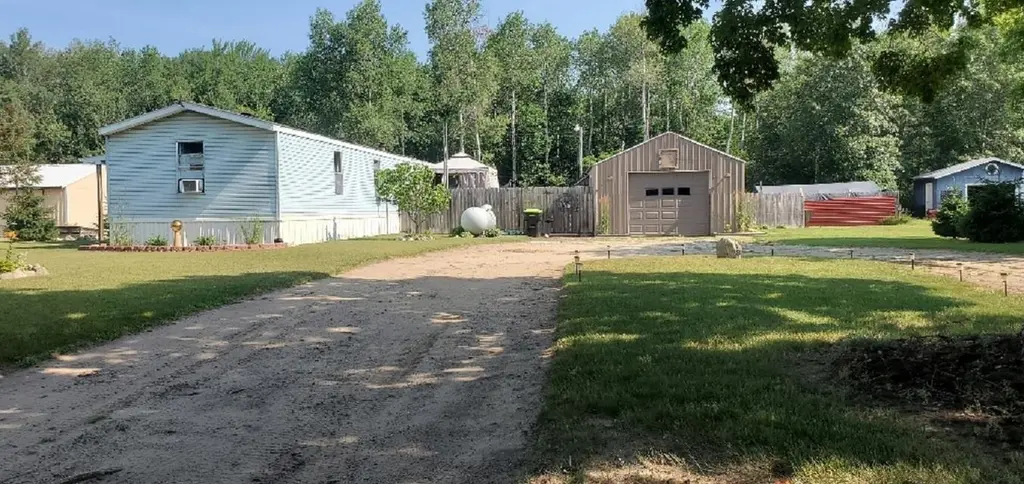
203 Fairview Blvd
Grant, MI 48622
$80,000C-
3 bd · 1.0 ba ·
980 sqft ·
Built 1993
· SingleFamily
· Active
· 93 DOM
Cashflow @ list (25.0% down · 7.5%)
Estimated rent
$789/mo
Mortgage (P&I)
−$420
Tax + insurance
−$133
HOA
−$0
Vac / Maint / Mgmt
−$166
Net cashflow
$71/mo
Annual
$850/yr
Cap rate
7.36%
Cash-on-cash
3.79%
DSCR
1.17
1% rule
0.99%
Cash to close
$22,400
Investor read
- This is a 3-bed/1.0-bath single-family listed at $80k.
- At list price, monthly cash flow is $71 ($850/yr) — positive.
- The deal already cash-flows at list — no discount required.
- To meet the 1% rule (rent ≥ 1% of price), the offer needs to be $79k (1.3% below list).
- It's been on market 93 days — a 9% lower offer ($73k) is reasonable based on typical stale-listing flexibility.
- Recommended offer: $73k (9.0% below list) — sets the bar for market timing.
- Local home prices are declining (-3.0%/yr); year-one equity from $553 of loan paydown is wiped out by about $2k of value loss. Plan a longer hold.
- Location reads 71/100 on livability (#291 in MI) — a middle-class / working-renter tenant base. Strengths: crime A+, cost of living A+, housing A+; Watch: amenities F, commute F, employment F.
- Farwell Area Schools (town): math 24% / reading 34% proficiency, ranked #388 of 540 in MI (top 72%) — low school quality limits family demand, transient renter base, plan for 1-2y turnover; 62% free/reduced lunch — lower-income household profile, screen leases tightly.
- Zoned schools: Farwell Elementary School (math 32% / reading 27%, grade F, #866 of 1,397 statewide, top 65%, 329 students, 77% FRL); Farwell Middle School (math 25% / reading 33%, grade F, #355 of 493 statewide, top 72%, 300 students, 68% FRL).
- Market conditions: 128 active listings in the ZIP; 77 units permitted in Clare County in 2024 (0 in 5+ unit buildings).
- Clare County population projected at -20% by 2050 — secular population decline; favor cash flow + early exit over multi-decade hold.
- 2 sale attempts; this cycle's ask has dropped $10k (11%) from the opening price — seller is motivated, your offer sets the floor, not the list.
- Current owner paid $26k; list at $80k implies a 208% gain — meaningful room to come down on a strong offer.
- Cap rate 7.4% vs local median 2.4% in Grant — top-decile yield for the area; either an underpriced asset or a hidden risk that comps aren't pricing in. Stress-test before assuming the spread holds.
Questions for listing agent
- It's been on market 93 days. Have you received any prior offers? Is the seller open to a 9% concession, seller financing, or rate buy-down credit?
- Why hasn't it sold? Are there any deal-killer items the seller is aware of (foundation, flood, title, zoning, code violations)?
- Is there a deadline driving the sale (1031 exchange, divorce, estate, relocation)? That informs how much negotiation room exists.
- What's the average days-on-market for RENTAL listings here right now (not sales)? A rising rental-DOM trend means longer vacancies and softer asking-rent achievability than the comps imply.
- What's the recent tenant-quality profile in this submarket — average credit score on applications, eviction rate, late-payment / NSF rate, and stable-employment percentage? A property-management company in the area should have these aggregated.
- How much new for-sale + rental construction is in the pipeline within 1–3 miles? Heavy new supply typically softens prices + rents 12–24 months out; constrained supply supports both.
CashFlowRE · CFR-HZHHJM1Q2FPHS5
· Data 9 h ago
cashflowre.app · 2026-05-29