203 Fairview Blvd · Grant, MI
Flood risk 1/10 · Minimal
- FEMA flood zone
- X (unshaded)
- Chance of flooding over 30 yrs
- 0.0%
- Est. flood insurance / yr
- $473 – $860
Fire risk 4/10 · Minor
- Est. fire insurance / yr
- $784 – $1,456
Heat risk 2/10 · Minimal
- Hot days now (above 96°F)
- 7 days/yr
- Hot days in 30 yrs
- 15 days/yr
Wind risk 1/10 · Minimal
- Chance of severe wind over 30 yrs
- —
Air-quality risk 2/10 · Minimal
- Unhealthy air days now
- 1 days/yr
- Unhealthy air days in 30 yrs
- 1 days/yr
Risk factors via First Street. Map © Google.
Why this score? — see what drove the C- grade
The composite is a weighted blend of 9 inputs, each scored 0–100. Each bar is that input's sub-score; the figure is the points it added to the 100-point composite (weight × sub-score).
- Cash flow +18.1/30.0
- ARV discount +15.0/15.0
- DSCR +5.7/10.0
- 1% rule +4.9/10.0
- Livability +3.6/5.0
- Rent growth +2.5/5.0
- Condition / age +2.5/5.0
- Schools +2.4/10.0
- Appreciation +0.0/10.0
$80,000
🖨 Deal sheet 📄 Offer letter ✓ Due diligence
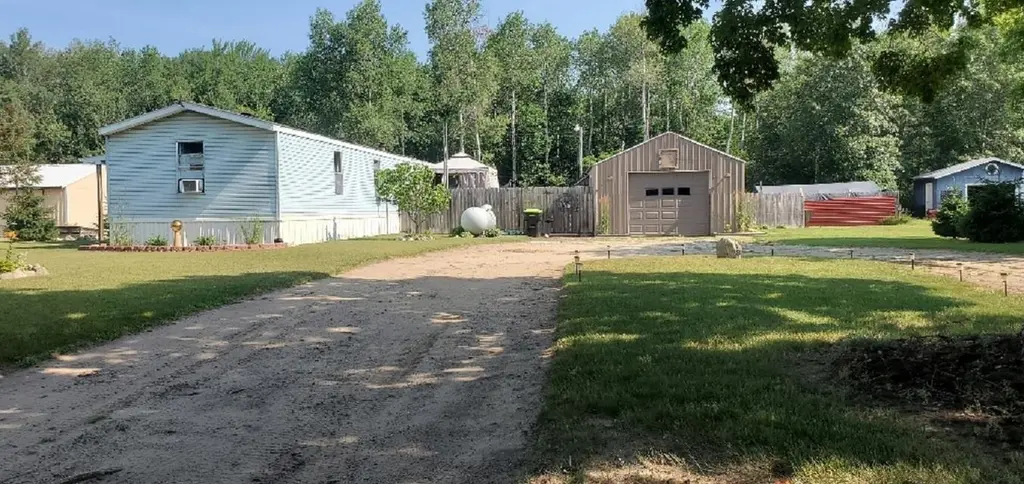
Listing remarks MLS
Welcome to this 3-bedroom, 2-bath single-wide home nestled on a generous . 91-acre double lot in Farwell! Offering 980 sq ft of living space, with primary bedroom featuring private full bath plus additional two bedrooms and second full bath. Detached 1-car garage with a man cave setup-perfect for hobbies, hangouts, or extra storage. The fenced-in yard is great for pets, kids, or just enjoying the outdoors. There's plenty of room to spread out, garden, and more.
Key facts
- Double lot
- Fenced-in yard
- 0.61 acre lot
Tags
Neighborhood map
What this means for you Summary
Snapshot
- This is a 3-bed/1.0-bath single-family listed at $80k.
Deal economics
- At list price, monthly cash flow is $71 ($850/yr) — positive.
- The deal already cash-flows at list — no discount required.
- To meet the 1% rule (rent ≥ 1% of price), the offer needs to be $79k (1.3% below list).
- Recommended offer: $75k (6.0% below list) — sets the bar for market timing.
- Cap rate 7.4% vs local median 2.7% in Grant — top-decile yield for the area; either an underpriced asset or a hidden risk that comps aren't pricing in. Stress-test before assuming the spread holds.
Location & tenants
- Location reads 71/100 on livability (#291 in MI) — a middle-class / working-renter tenant base. Strengths: crime A+, cost of living A+, housing A+; Watch: amenities F, commute F, employment F.
- Farwell Area Schools (town): math 24% / reading 34% proficiency, ranked #388 of 540 in MI (top 72%) — low school quality limits family demand, transient renter base, plan for 1-2y turnover; 62% free/reduced lunch — lower-income household profile, screen leases tightly.
- Market conditions: 126 active listings in the ZIP; 77 units permitted in Clare County in 2024 (0 in 5+ unit buildings).
Forward outlook
- Local home prices are declining (-3.0%/yr); year-one equity from $553 of loan paydown is wiped out by about $2k of value loss. Plan a longer hold.
- Clare County population projected at -20% by 2050 — secular population decline; favor cash flow + early exit over multi-decade hold.
Negotiation context
- It's been on market 90 days — a 6% lower offer ($75k) is reasonable based on typical stale-listing flexibility.
- 2 sale attempts; this cycle's ask has dropped $10k (11%) from the opening price — seller is motivated, your offer sets the floor, not the list.
- Current owner paid $26k; list at $80k implies a 208% gain — meaningful room to come down on a strong offer.
Questions for the listing agent
- It's been on market 90 days. Have you received any prior offers? Is the seller open to a 6% concession, seller financing, or rate buy-down credit?
- Why hasn't it sold? Are there any deal-killer items the seller is aware of (foundation, flood, title, zoning, code violations)?
- Is there a deadline driving the sale (1031 exchange, divorce, estate, relocation)? That informs how much negotiation room exists.
- What's the average days-on-market for RENTAL listings here right now (not sales)? A rising rental-DOM trend means longer vacancies and softer asking-rent achievability than the comps imply.
- What's the recent tenant-quality profile in this submarket — average credit score on applications, eviction rate, late-payment / NSF rate, and stable-employment percentage? A property-management company in the area should have these aggregated.
- How much new for-sale + rental construction is in the pipeline within 1–3 miles? Heavy new supply typically softens prices + rents 12–24 months out; constrained supply supports both.
Investment metrics
- 1% rule
- 0.99% ✗
- Cap rate
- 7.36%
- Cash-on-cash
- 3.79%
- DSCR
- 1.17
- GRM
- 8.4
CMA / ARV
- ARV (median comp)
- $132,785
- List price
- $80,000
- Delta
- -39.75%
- Verdict
- UNDERPRICED
- Comps
- 12 within 1.0 mi
Show comp detail 4 sales within ~0.75 mi
| Address | Dist | Beds/Ba | Sqft | Sold | Price | $/sf | Match |
|---|---|---|---|---|---|---|---|
| 103 W Ludington Dr | 0.35mi | 3/1.5 | 1,040 (+6%) | 7mo | $161,753 | $156 | 65 |
| 11255 Beaver Ave | 0.51mi | 3/1.5 | 1,008 (+3%) | 13mo | $176,175 | $175 | 59 |
| 609 E Main St | 0.67mi | 3/1.0 | 1,008 (+3%) | 12mo | $115,750 | $115 | 54 |
| 166 Merrill St | 0.74mi | 3/1.0 | 1,008 (+3%) | 16mo | $106,000 | $105 | 48 |
Match score weights: distance 35% · size 25% · config 20% · recency 20%. Top-matched comps best support the ARV.
Projected returns pro-forma
-3.0% appreciation · 3.0% rent growth · sell at horizon
- IRR
- -10.3%
- Equity multiple
- 0.62×
- Total profit
- $-8,441
- Equity at exit
- $11,928
- IRR
- -1.0%
- Equity multiple
- 0.93×
- Total profit
- $-1,494
- Equity at exit
- $6,917
Cash invested: $22,400 (down + closing). Projections, not guarantees.
Landlord ↔ Tenant lean methodology
- Overall (STATE)
- 62 Landlord-Friendly
- State Michigan
- 62 Landlord-Friendly · EVEN
- County
- — inherits STATE
- City
- — inherits STATE
ZIP-level market 48622
- Home prices YoY
- -23.9%
- Active inventory
- 126
- Price-to-rent
- 8.4×
Monthly cashflow live
- Estimated rent
- $789 medium interval (Pro) →
- Mortgage (P&I)
- −$420
- Tax est. 1.5%
- −$100 /mo · $1,200/yr
- Insurance
- −$33
- HOA
- −$0
- Vacancy / Maint / Mgmt
- −$166
- Net cashflow
- $71
Break-even live
UW: 25.0% down · 7.5% · 30yr · 1.5% tax · 5.0% vac · 8.0% maint · 8.0% mgmt
Financing live
Cash to close
- Down payment
- $20,000
- Closing costs
- $2,400
- Reserves months
- —
- Total cash needed
- —
Loan-product check · same deal, 3 products live
Conventional
25% down · 7.5% · 30yr
- Down + closing
- —
- Monthly P&I
- —
- Monthly cashflow
- —
- DSCR
- —
- Eligible?
- —
Personal DTI + credit; lowest rate.
DSCR
20% down · 8.5% · 30yr
- Down + closing
- —
- Monthly P&I
- —
- Monthly cashflow
- —
- DSCR
- —
- Eligible?
- —
No personal income docs; deal must DSCR.
Hard money
10% down · 12.0% · 12mo
- Down + closing
- —
- Monthly P&I
- —
- Monthly cashflow
- —
- DSCR
- —
- Eligible?
- —
Short-term bridge; refi at stabilization.
Listing history 20 events
-
2026-06-18days on market $80,000 Active 90 DOM
-
2026-06-17days on market $80,000 Active 89 DOM
-
2026-06-16days on market $80,000 Active 88 DOM
-
2026-06-15days on market $80,000 Active 87 DOM
-
2026-06-13days on market $80,000 Active 85 DOM
-
2026-06-12pricedays on market $80,000 Active 84 DOM
-
2026-06-09days on market $82,999 Active 81 DOM
-
2026-06-08days on market $82,999 Active 80 DOM
-
2026-06-07days on market $82,999 Active 79 DOM
-
2026-06-07days on market $82,999 Active 78 DOM
-
2026-06-04days on market $82,999 Active 75 DOM
-
2026-06-02days on market $82,999 Active 74 DOM
-
2026-06-01days on market $82,999 Active 73 DOM
-
2026-05-31days on market $82,999 Active 72 DOM
-
2026-05-31days on market $82,999 Active 71 DOM
-
2026-05-06price $82,999 466-char remark
Show marketing remark (466 chars)
Welcome to this 3-bedroom, 2-bath single-wide home nestled on a generous . 91-acre double lot in Farwell! Offering 980 sq ft of living space, with primary bedroom featuring private full bath plus additional two bedrooms and second full bath. Detached 1-car garage with a man cave setup-perfect for hobbies, hangouts, or extra storage. The fenced-in yard is great for pets, kids, or just enjoying the outdoors. There's plenty of room to spread out, garden, and more.
-
2026-04-23price $85,999 466-char remark
Show marketing remark (466 chars)
Welcome to this 3-bedroom, 2-bath single-wide home nestled on a generous . 91-acre double lot in Farwell! Offering 980 sq ft of living space, with primary bedroom featuring private full bath plus additional two bedrooms and second full bath. Detached 1-car garage with a man cave setup-perfect for hobbies, hangouts, or extra storage. The fenced-in yard is great for pets, kids, or just enjoying the outdoors. There's plenty of room to spread out, garden, and more.
-
2026-03-20$90,000 Active 466-char remark
Show marketing remark (466 chars)
Welcome to this 3-bedroom, 2-bath single-wide home nestled on a generous . 91-acre double lot in Farwell! Offering 980 sq ft of living space, with primary bedroom featuring private full bath plus additional two bedrooms and second full bath. Detached 1-car garage with a man cave setup-perfect for hobbies, hangouts, or extra storage. The fenced-in yard is great for pets, kids, or just enjoying the outdoors. There's plenty of room to spread out, garden, and more.
-
2025-07-08$68,500 Active
-
2014-09-08soldstatus $26,000
ⓘ Source: listings_history table (triggers on properties + properties_extension) + one-shot
backfill from property_details.listing_events for pre-trigger history.
Climate risk First Street
- Flood 1/10 Low FEMA zone X (unshaded) · 0% chance over 30 yrs
- Wildfire 4/10 Moderate
- Heat 2/10 Low 7 d/yr ≥96°F today · 15 d/yr by 30 yrs out
- Wind 1/10 Low
- Air quality 2/10 Low 1 unhealthy d/yr today · 1 by 30 yrs out
Nearby sold comps map
Loading sold comps map…
Walkable amenities ~0.75 mi
Loading nearby amenities…
Taxation est. · year 1
- Rental income
- $9,474
- − Mortgage interest
- −$4,481
- − Property taxes
- −$1,200
- − Insurance
- −$400
- − Repairs & maintenance
- −$758
- − Management
- −$758
- − Depreciation
- −$2,327
- Taxable loss
- −$451
- Est. tax savings @ 24.0%
- +$108
- After-tax cash flow
- $958/yr
For passive investors: Depreciation is non-cash, so a rental often shows a tax loss while cash-flowing — sheltering income. Rental losses are passive: they offset passive income freely, and up to $25,000/yr can offset ordinary (W-2) income if you actively participate and your MAGI is under $100k (phasing out to $0 by $150k); unused losses carry forward. On sale, claimed depreciation is recaptured at up to 25%, and gains may owe capital-gains tax (a 1031 exchange can defer both). Figures are a year-1 estimate at your 24.0% rate — not tax advice; consult a CPA.
Schools (NCES district)
- District
- Farwell Area Schools
- NCES district ID
- 2614100
- Math proficiency
- 24% ▼ -8.00%
- Reading proficiency
- 34% ▼ -8.00%
- Median HH income
- $36,696
- Composite
- 24.07/100
- National rank
- #7760
- State rank
- #388 of 540 in MI
Livability — Grant
- Score
- 71/100
- State rank
- #291
- US rank
- #7290
Category grades
Schools grade is shown separately in the Schools card above.
Census & demographics
- Population (ZIP)
- 5,970
Population outlook (Clare County) Hauer SSP2
- Today (2025)
- 29,283 people
- By 2030
- 28,199 · -3.7%
- By 2040
- 25,722 · -12.2%
- By 2050
- 23,372 · -20.2%
- By 2075
- 18,569 · -36.6%
- By 2100
- 14,320 · -51.1%
Race, ethnicity, and origin ACS 2023
- Neighborhood character
- Predominantly White (91%)
- Race & ethnicity
- White 91% Two or more races 4% Hispanic / Latino 3% Black 1%
- Common ancestry
- Romanian 5% Lithuanian 3% Iranian 2%
- Foreign-born
- 0%
- Languages at home
- 98% English-only · German/W. Germanic 2%
Political lean MEDSL · Clare
- 2024 margin
- Solid R (+37.6) · D 30.5% · R 68.1% · Other 1.4%
- 2008→2024 swing
- -42.4pp toward R · 2008: 4.8pp · 2024: -37.6pp
- All cycles
- 2024: R+37.6 2020: R+34.8 2016: R+31.8 2012: R+4.8 2008: D+4.8
Not yet ingested
- Civics
- —
Market trends
- HPI YoY
- ▼ -71.95%
- Current HPI
- 229.7867
- Rent YoY
- —
- Metro
- —
- State GDP YoY
- ▲ 1.37%
- F500 in state
- 28
Industry mix (Fortune 500 HQ in MI)
| Industry | F500 HQs | Revenue |
|---|---|---|
| Automotive Parts | 3 | $48B |
|
||
| Automotive | 2 | $372B |
|
||
| Chemicals | 1 | $45B |
|
||
| Automotive Retail | 1 | $29B |
|
||
| Healthcare / Medical Devices | 1 | $23B |
|
||
| Automotive Technology | 1 | $20B |
|
||
Price history
+219.2% since first listed5 events — show timeline
- 2026-05-06 Price Changed $82,999 REALCOMP
- 2026-04-23 Price Changed $85,999 REALCOMP
- 2026-03-20 Listed $90,000 REALCOMP
- 2025-07-08 Listed $68,500 REALCOMP
- 2014-09-08 Sold (Public Records) $26,000 Public Records
Property tax history
-1.4%/yrLatest (2025): $65 · -74.3% YoY. Source: county tax records.
Cash-flow waterfall
monthlySold comps — $/sqft
last 12 mo · ≤1 miLoading sold comps…