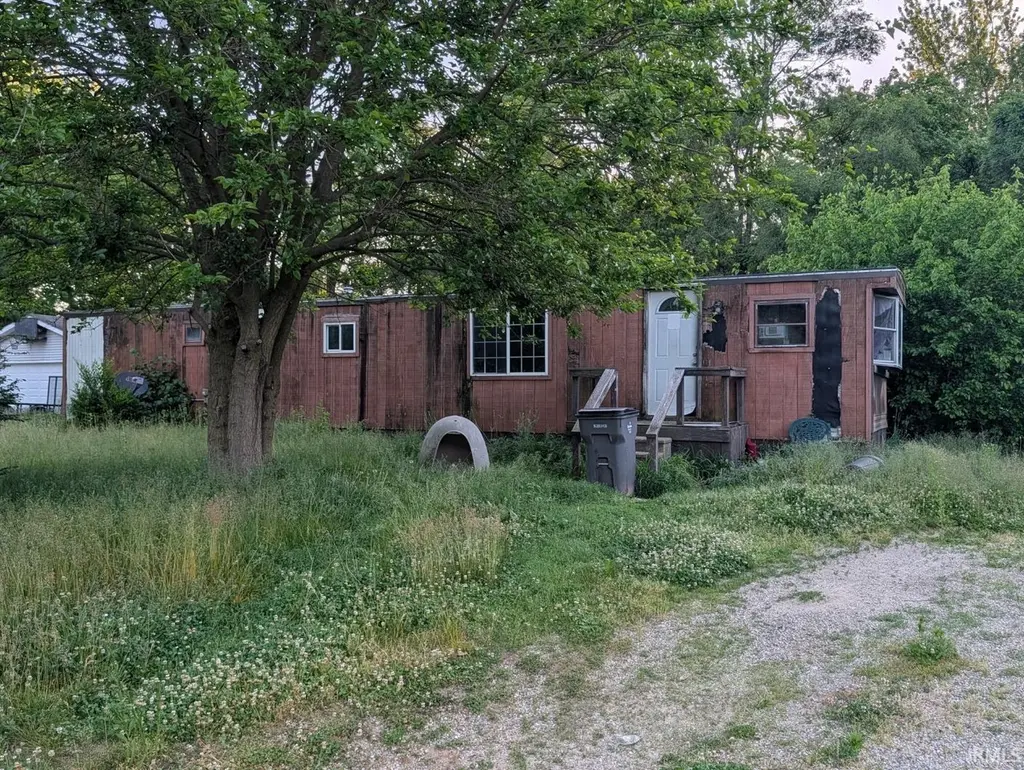
50682 Manhatten Ave
Granger, IN 46514
$39,900B+
3 bd · 1.0 ba ·
1,232 sqft ·
Built 1970
· Manufactured
· Pending
· 12 DOM
Cashflow @ list (25.0% down · 7.5%)
Estimated rent
$1,588/mo
Mortgage (P&I)
−$209
Tax + insurance
−$113
HOA
−$0
Vac / Maint / Mgmt
−$334
Net cashflow
$933/mo
Annual
$11,194/yr
Cap rate
34.35%
Cash-on-cash
100.19%
DSCR
5.46
1% rule
3.98%
Cash to close
$11,172
Investor read
- This is a 3-bed/1.0-bath manufactured listed at $40k.
- At list price, monthly cash flow is $933 ($11k/yr) — positive.
- The deal already cash-flows at list — no discount required.
- Meets the 1% rule at list price ($2k rent vs $40k).
- Only 12 days on market — expect competitive offers; lowballing is unlikely to land.
- Local home prices are declining (-3.0%/yr); year-one equity from $276 of loan paydown is wiped out by about $1k of value loss. Plan a longer hold.
- Location reads 78/100 on livability (#33 in IN, #2,584 nationally) — a middle-class / working-renter tenant base. Strengths: crime A+, employment A+, cost of living A+; Watch: amenities F, commute F.
- Elkhart Community Schools (urban): math 18% / reading 25% proficiency, ranked #271 of 301 in IN (top 90%) — low school quality limits family demand, transient renter base, plan for 1-2y turnover.
- Zoned schools: Mary Feeser Elementary School (math 21% / reading 21%, grade F, #807 of 994 statewide, top 81%, 504 students, 61% FRL); West Side Middle School (math 15% / reading 31%, grade F, #263 of 330 statewide, top 80%, 582 students, 67% FRL); Elkhart High School (math 17% / reading 51%, grade F, #285 of 369 statewide, top 78%, 3,325 students, 63% FRL) — zoned schools at 64% FRL track the district average.
- Watch-outs: property tax is 2.9% of price.
- Market conditions: Rents rising fast (+7.0%/yr); 269 active listings in the ZIP; 484 units permitted in Elkhart County in 2024 (136 in 5+ unit buildings).
- Elkhart County population projected at +7% by 2050 — modest demand growth; plan on rents tracking national, not racing it.
- 2 sale attempts since 11y ago with the ask held roughly flat each time — persistent listings suggest the price (not the market) is what's stuck; bring a comps-based counter.
- Current owner paid $15k; list at $40k implies a 168% gain — meaningful room to come down on a strong offer.
- At projected returns (-3.0% appreciation + 7.0% rent growth), your $11k cash investment doubles in ~2 years — after that, you're playing with house money.
- Cap rate 34.3% vs local median 3.3% in Granger — top-decile yield for the area; either an underpriced asset or a hidden risk that comps aren't pricing in. Stress-test before assuming the spread holds.
Questions for listing agent
- Built in 1970 — when were the roof, HVAC, electrical panel, plumbing, and water heater last replaced?
- Property tax is high relative to price — has the assessment been appealed recently, and will the sale trigger a re-assessment?
- Is there a deadline driving the sale (1031 exchange, divorce, estate, relocation)? That informs how much negotiation room exists.
- Schools are A-rated — typically a magnet for longer-tenancy family renters. What's the average tenant stay here, and is there a school-zone premium baked into asking?
- What's the average days-on-market for RENTAL listings here right now (not sales)? A rising rental-DOM trend means longer vacancies and softer asking-rent achievability than the comps imply.
- What's the recent tenant-quality profile in this submarket — average credit score on applications, eviction rate, late-payment / NSF rate, and stable-employment percentage? A property-management company in the area should have these aggregated.
- How much new for-sale + rental construction is in the pipeline within 1–3 miles? Heavy new supply typically softens prices + rents 12–24 months out; constrained supply supports both.
CashFlowRE · CFR-HZXMM32HPSRKBN
· Data 2 days ago
cashflowre.app · 2026-05-29