50682 Manhatten Ave · Granger, IN
Flood risk 1/10 · Minimal
- FEMA flood zone
- X (unshaded)
- Chance of flooding over 30 yrs
- 0.0%
- Est. flood insurance / yr
- $473 – $860
Fire risk 1/10 · Minimal
- Est. fire insurance / yr
- $717 – $1,331
Heat risk 2/10 · Minimal
- Hot days now (above 101°F)
- 7 days/yr
- Hot days in 30 yrs
- 16 days/yr
Wind risk 2/10 · Minimal
- Chance of severe wind over 30 yrs
- —
Air-quality risk 2/10 · Minimal
- Unhealthy air days now
- 1 days/yr
- Unhealthy air days in 30 yrs
- 2 days/yr
Risk factors via First Street. Map © Google.
Why this score? — see what drove the B+ grade
The composite is a weighted blend of 9 inputs, each scored 0–100. Each bar is that input's sub-score; the figure is the points it added to the 100-point composite (weight × sub-score).
- Cash flow +30.0/30.0
- ARV discount +15.0/15.0
- 1% rule +10.0/10.0
- DSCR +10.0/10.0
- Rent growth +4.3/5.0
- Livability +3.9/5.0
- Condition / age +2.5/5.0
- Schools +1.8/10.0
- Appreciation +0.0/10.0
$39,900
🖨 Deal sheet 📄 Offer letter ✓ Due diligence
Listing remarks MLS
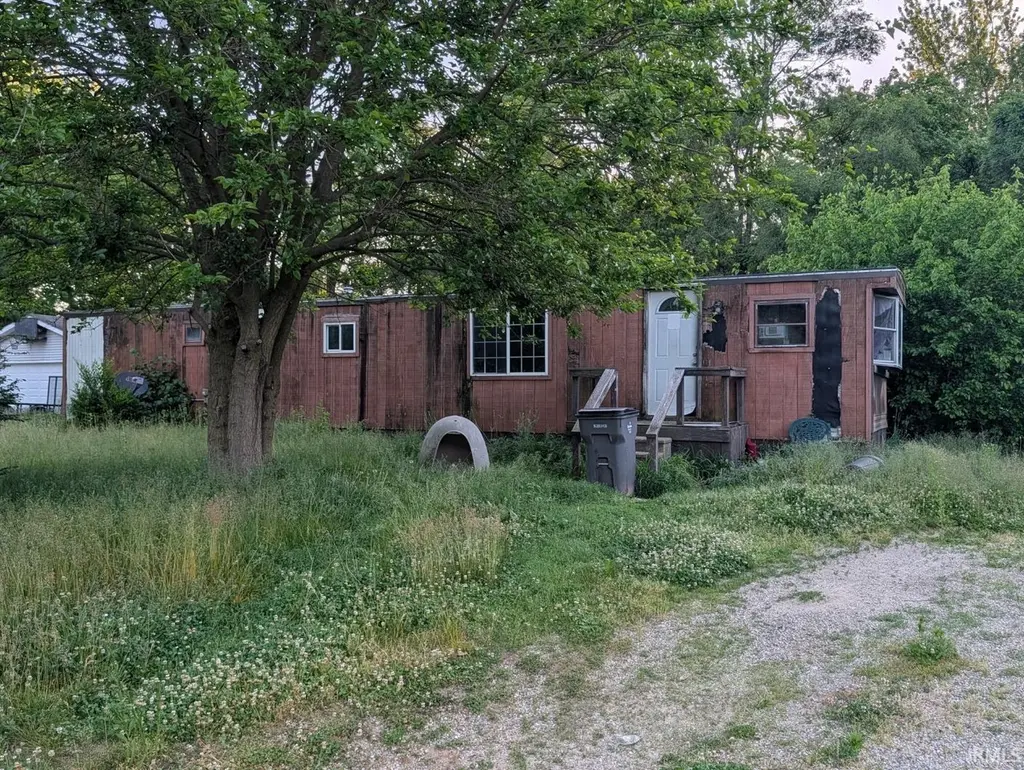
Manufactured home on a 0.363 acre lot in Michiana Acres. Large backyard and storage shed. This home has a living room, kitchen, 3 bedrooms, 1 bathroom, and a partial basement. Needs work, priced accordingly.
Key facts
- Northside location
- Flexible layout
- Spacious lot
Tags
Property features AI
Finance
- Financial info: Annual tax amount reported
Exterior
- Utilities: Sewer: Unknown
- Home design: Manufactured home (residential); Single-story
- Construction: Wood siding exterior; Block foundation
- Exterior features: Level lot; Lot dimensions approximately 100 x 157; Lot size about 0.36 acres; Subdivision: Michiana Acres
Interior
- Bathrooms: One full bathroom; One main-level bathroom
- Heating & cooling: Has cooling (type: Other); No heating listed
- Interior features: Partial basement; Basement present
Neighborhood map
What this means for you Summary
Snapshot
- This is a 3-bed/1.0-bath manufactured listed at $40k.
Deal economics
- At list price, monthly cash flow is $933 ($11k/yr) — positive.
- The deal already cash-flows at list — no discount required.
- Meets the 1% rule at list price ($2k rent vs $40k).
- Cap rate 34.3% vs local median 3.3% in Granger — top-decile yield for the area; either an underpriced asset or a hidden risk that comps aren't pricing in. Stress-test before assuming the spread holds.
Location & tenants
- Location reads 78/100 on livability (#33 in IN, #2,584 nationally) — a middle-class / working-renter tenant base. Strengths: crime A+, employment A+, cost of living A+; Watch: amenities F, commute F.
- Elkhart Community Schools (urban): math 18% / reading 25% proficiency, ranked #271 of 301 in IN (top 90%) — low school quality limits family demand, transient renter base, plan for 1-2y turnover.
- Zoned schools: Mary Feeser Elementary School (math 21% / reading 21%, grade F, #807 of 994 statewide, top 81%, 504 students, 61% FRL); West Side Middle School (math 15% / reading 31%, grade F, #263 of 330 statewide, top 80%, 582 students, 67% FRL); Elkhart High School (math 17% / reading 51%, grade F, #285 of 369 statewide, top 78%, 3,325 students, 63% FRL) — zoned schools at 64% FRL track the district average.
- Market conditions: Rents rising fast (+7.0%/yr); 269 active listings in the ZIP; 484 units permitted in Elkhart County in 2024 (136 in 5+ unit buildings).
Forward outlook
- Local home prices are declining (-3.0%/yr); year-one equity from $276 of loan paydown is wiped out by about $1k of value loss. Plan a longer hold.
- Elkhart County population projected at +7% by 2050 — modest demand growth; plan on rents tracking national, not racing it.
- At projected returns (-3.0% appreciation + 7.0% rent growth), your $11k cash investment doubles in ~2 years — after that, you're playing with house money.
Negotiation context
- Only 12 days on market — expect competitive offers; lowballing is unlikely to land.
- 2 sale attempts since 11y ago with the ask held roughly flat each time — persistent listings suggest the price (not the market) is what's stuck; bring a comps-based counter.
- Current owner paid $15k; list at $40k implies a 168% gain — meaningful room to come down on a strong offer.
Risks & watch-outs
- Watch-outs: property tax is 2.9% of price.
Questions for the listing agent
- Built in 1970 — when were the roof, HVAC, electrical panel, plumbing, and water heater last replaced?
- Property tax is high relative to price — has the assessment been appealed recently, and will the sale trigger a re-assessment?
- Is there a deadline driving the sale (1031 exchange, divorce, estate, relocation)? That informs how much negotiation room exists.
- Schools are A-rated — typically a magnet for longer-tenancy family renters. What's the average tenant stay here, and is there a school-zone premium baked into asking?
- What's the average days-on-market for RENTAL listings here right now (not sales)? A rising rental-DOM trend means longer vacancies and softer asking-rent achievability than the comps imply.
- What's the recent tenant-quality profile in this submarket — average credit score on applications, eviction rate, late-payment / NSF rate, and stable-employment percentage? A property-management company in the area should have these aggregated.
- How much new for-sale + rental construction is in the pipeline within 1–3 miles? Heavy new supply typically softens prices + rents 12–24 months out; constrained supply supports both.
Investment metrics
- 1% rule
- 3.98% ✓
- Cap rate
- 34.35%
- Cash-on-cash
- 100.19%
- DSCR
- 5.46
- GRM
- 2.1
CMA / ARV
- ARV (on-the-fly)
- $64,064
- Comps found
- 1
Show comp detail 1 sale within ~0.75 mi
| Address | Dist | Beds/Ba | Sqft | Sold | Price | $/sf | Match |
|---|---|---|---|---|---|---|---|
| 30318 Chevy Chase Dr | 0.16mi | 2/2.0 (-1) | 1,130 (-8%) | 6mo | $59,000 | $52 | 65 |
Match score weights: distance 35% · size 25% · config 20% · recency 20%. Top-matched comps best support the ARV.
Projected returns pro-forma
-3.0% appreciation · 7.03% rent growth · sell at horizon
- IRR
- —
- Equity multiple
- 6.34×
- Total profit
- $59,697
- Equity at exit
- $5,949
- IRR
- —
- Equity multiple
- 15.19×
- Total profit
- $158,575
- Equity at exit
- $3,450
Cash invested: $11,172 (down + closing). Projections, not guarantees.
Landlord ↔ Tenant lean methodology
- Overall (STATE)
- 90 Strongly Landlord-Friendly
- State Indiana
- 90 Strongly Landlord-Friendly · R+11
- County
- — inherits STATE
- City
- — inherits STATE
ZIP-level market 46514
- Rents YoY
- 7.0%
- Active inventory
- 269
- Price-to-rent
- 2.1×
Monthly cashflow live
- Estimated rent
- $1,588 medium interval (Pro) →
- Mortgage (P&I)
- −$209
- Tax from tax record
- −$96 /mo · $1,151/yr
- Insurance
- −$17
- HOA
- −$0
- Vacancy / Maint / Mgmt
- −$334
- Net cashflow
- $933
Break-even live
UW: 25.0% down · 7.5% · 30yr · 1.5% tax · 5.0% vac · 8.0% maint · 8.0% mgmt
Financing live
Cash to close
- Down payment
- $9,975
- Closing costs
- $1,197
- Reserves months
- —
- Total cash needed
- —
Loan-product check · same deal, 3 products live
Conventional
25% down · 7.5% · 30yr
- Down + closing
- —
- Monthly P&I
- —
- Monthly cashflow
- —
- DSCR
- —
- Eligible?
- —
Personal DTI + credit; lowest rate.
DSCR
20% down · 8.5% · 30yr
- Down + closing
- —
- Monthly P&I
- —
- Monthly cashflow
- —
- DSCR
- —
- Eligible?
- —
No personal income docs; deal must DSCR.
Hard money
10% down · 12.0% · 12mo
- Down + closing
- —
- Monthly P&I
- —
- Monthly cashflow
- —
- DSCR
- —
- Eligible?
- —
Short-term bridge; refi at stabilization.
Listing history 11 events
-
2026-06-17status $39,900 Pending 12 DOM
-
2026-06-16days on market $39,900 Active 12 DOM
-
2026-06-15days on market $39,900 Active 11 DOM
-
2026-06-14days on market $39,900 Active 9 DOM
-
2026-06-13days on market $39,900 Active 8 DOM
-
2026-06-10days on market $39,900 Active 6 DOM
-
2026-06-09days on market $39,900 Active 5 DOM
-
2026-06-08days on market $39,900 Active 4 DOM
-
2026-06-07days on market $39,900 Active 3 DOM
-
2026-06-05remarks 427-char remark
-
2026-06-05$39,900 Active 1 DOM
ⓘ Source: listings_history table (triggers on properties + properties_extension) + one-shot
backfill from property_details.listing_events for pre-trigger history.
Tax reassessment forecast IN · Partial reset (capped growth)
- Current annual tax
- $1,151 · $96/mo
- Projected year-2 tax
- $1,151 · $96/mo
- Expected delta
- $0/yr ($0/mo · 0.0%)
ⓘ Screening estimate from a state-policy table — verify with the county assessor before closing.
Climate risk First Street
- Flood 1/10 Low FEMA zone X (unshaded) · 0% chance over 30 yrs
- Wildfire 1/10 Low
- Heat 2/10 Low 7 d/yr ≥101°F today · 16 d/yr by 30 yrs out
- Wind 2/10 Low
- Air quality 2/10 Low 1 unhealthy d/yr today · 2 by 30 yrs out
Nearby sold comps map
Loading sold comps map…
Walkable amenities ~0.75 mi
Loading nearby amenities…
Taxation est. · year 1
- Rental income
- $19,057
- − Mortgage interest
- −$2,235
- − Property taxes
- −$1,151
- − Insurance
- −$200
- − Repairs & maintenance
- −$1,525
- − Management
- −$1,525
- − Depreciation
- −$1,161
- Taxable income
- $11,262
- Est. tax owed @ 24.0%
- −$2,703
- After-tax cash flow
- $8,491/yr
For passive investors: Depreciation is non-cash, so a rental often shows a tax loss while cash-flowing — sheltering income. Rental losses are passive: they offset passive income freely, and up to $25,000/yr can offset ordinary (W-2) income if you actively participate and your MAGI is under $100k (phasing out to $0 by $150k); unused losses carry forward. On sale, claimed depreciation is recaptured at up to 25%, and gains may owe capital-gains tax (a 1031 exchange can defer both). Figures are a year-1 estimate at your 24.0% rate — not tax advice; consult a CPA.
Schools (NCES district)
- District
- Elkhart Community Schools
- NCES district ID
- 1803270
- Math proficiency
- 18% ▼ -12.00%
- Reading proficiency
- 25% ▼ -9.00%
- Median HH income
- $42,881
- Composite
- 18.45/100
- National rank
- #8928
- State rank
- #271 of 301 in IN
Livability — Granger
- Score
- 78/100
- State rank
- #33
- US rank
- #2584
Category grades
Schools grade is shown separately in the Schools card above.
Census & demographics
- County
- Elkhart County · 107,928 people
- City population
- 31,598
- Metro
- Elkhart-Goshen, IN
- Population (ZIP)
- 42,389
- Household income
- $65,833
- Rent vs Own
- Severe rent burden
- 1061.0
Population outlook (Elkhart County) Hauer SSP2
- Today (2025)
- 213,761 people
- By 2030
- 218,103 · +2.0%
- By 2040
- 225,381 · +5.4%
- By 2050
- 229,447 · +7.3%
- By 2075
- 232,856 · +8.9%
- By 2100
- 214,088 · +0.2%
Race, ethnicity, and origin ACS 2023
- Neighborhood character
- Predominantly White (74%)
- Race & ethnicity
- White 74% Hispanic / Latino 14% Two or more races 6% Black 5% Asian 1%
- Hispanic origin (detail)
- Mexican 10%
- Common ancestry
- Lithuanian 2% Romanian 2% Italian 2%
- Foreign-born
- 8% · Canada
- Languages at home
- 89% English-only · Spanish 10%
Political lean MEDSL · Elkhart
- 2024 margin
- Solid R (+32.4) · D 33.1% · R 65.5% · Other 1.4%
- 2008→2024 swing
- -21.2pp toward R · 2008: -11.2pp · 2024: -32.4pp
- All cycles
- 2024: R+32.4 2020: R+28.1 2016: R+32.4 2012: R+26.5 2008: R+11.2
Not yet ingested
- Civics
- —
Market trends
- HPI YoY
- ▼ -246.78%
- Current HPI
- 225.6
- Rent YoY
- ▲ 7.03%
- Metro
- Elkhart-Goshen, IN
- State GDP YoY
- ▲ 2.90%
- F500 in state
- 18
Industry mix (Fortune 500 HQ in IN)
| Industry | F500 HQs | Revenue |
|---|---|---|
| Industrial Machinery | 2 | $37B |
|
||
| Healthcare | 1 | $177B |
|
||
| Pharmaceuticals | 1 | $45B |
|
||
| Metals / Steel | 1 | $18B |
|
||
| Agriculture | 1 | $17B |
|
||
| Packaging | 1 | $12B |
|
||
Price history
+167.8% since first listed3 events — show timeline
- 2026-06-04 Listed $39,900 IRMLS
- 2016-01-15 Sold (MLS) $14,900 IRMLS
- 2015-12-15 Listed $14,900 IRMLS
Property tax history
+2.1%/yrLatest (2025): $1,151 · -2.7% YoY. Source: county tax records.
Cash-flow waterfall
monthlySold comps — $/sqft
last 12 mo · ≤1 miLoading sold comps…