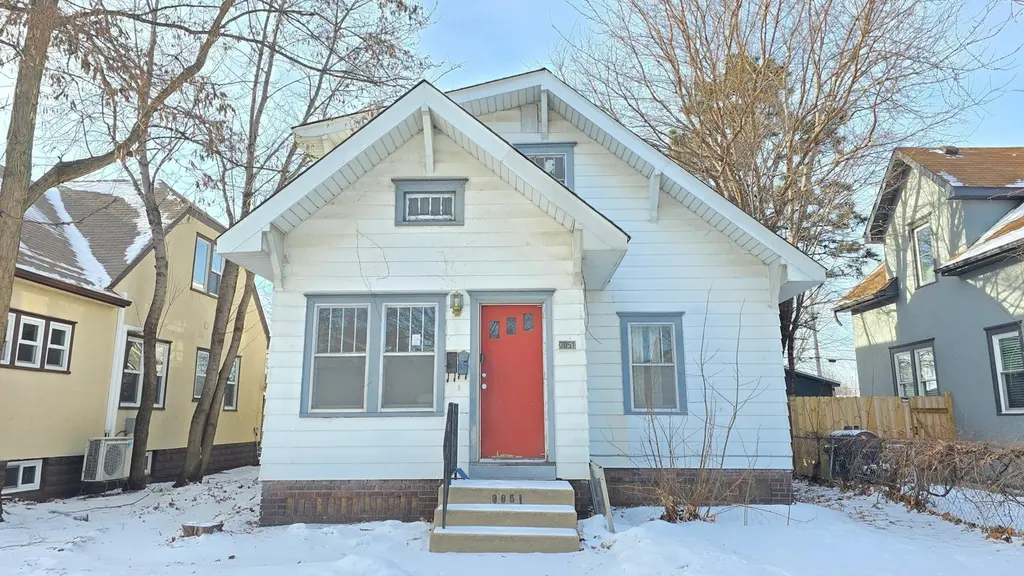
3851 Aldrich Ave N
Minneapolis, MN 55412
$140,900B
3 bd · 2.0 ba ·
2,104 sqft ·
Built 1916
· Other
· Pending
· 1 DOM
Cashflow @ list (25.0% down · 7.5%)
Estimated rent
$2,376/mo
Mortgage (P&I)
−$739
Tax + insurance
−$235
HOA
−$0
Vac / Maint / Mgmt
−$499
Net cashflow
$903/mo
Annual
$10,842/yr
Cap rate
13.99%
Cash-on-cash
27.48%
DSCR
2.22
1% rule
1.69%
Cash to close
$39,452
Investor read
- This is a 3-bed/2.0-bath other listed at $141k.
- At list price, monthly cash flow is $903 ($11k/yr) — positive.
- The deal already cash-flows at list — no discount required.
- Meets the 1% rule at list price ($2k rent vs $141k).
- Only 1 days on market — expect competitive offers; lowballing is unlikely to land.
- Local home prices are declining (-3.0%/yr); year-one equity from $974 of loan paydown is wiped out by about $4k of value loss. Plan a longer hold.
- Location reads 78/100 on livability (#110 in MN, #2,525 nationally) — a middle-class / working-renter tenant base. Strengths: amenities A+, commute A+, housing A+; Watch: cost of living C-, crime F.
- Minneapolis Public School District (urban): math 35% / reading 46% proficiency, ranked #217 of 301 in MN (top 72%) — families likely to look elsewhere, expect single-tenant / working-renter base with shorter leases.
- Watch-outs: built in 1916 — expect roof / HVAC / electrical / plumbing capex.
- Market conditions: Rents rising fast (+6.3%/yr); 169 active listings in the ZIP; 7 comparable units currently listed for rent nearby; rentals lingering (median 44d on market — plan ~5-8 weeks vacancy on turnover, expect pricing pressure); 57% of comp listings sitting > 30 days — soft ceiling on asking rent; 4,651 units permitted in Hennepin County in 2024 (2,443 in 5+ unit buildings).
- Hennepin County population projected at +30% by 2050 — long-run rental-demand tailwind backs the buy-and-hold thesis.
- 3 sale attempts since 30y ago with the ask held roughly flat each time — persistent listings suggest the price (not the market) is what's stuck; bring a comps-based counter.
- Current owner paid $115k; 23% above their basis — modest negotiation headroom, anchor on the comps not their cost.
- At projected returns (-3.0% appreciation + 6.3% rent growth), your $39k cash investment doubles in ~4 years — after that, you're playing with house money.
- Cap rate 14.0% vs local median 3.1% in Minneapolis — top-decile yield for the area; either an underpriced asset or a hidden risk that comps aren't pricing in. Stress-test before assuming the spread holds.
- This rent runs 42% of the median local income ($69k/yr) — at the standard rent-burdened threshold; future hikes will face affordability resistance.
Questions for listing agent
- Built in 1916 — when were the roof, HVAC, electrical panel, plumbing, and water heater last replaced?
- Is there a deadline driving the sale (1031 exchange, divorce, estate, relocation)? That informs how much negotiation room exists.
- Crime grade is F in this area — have there been break-ins, vandalism, or insurance claims at this property in the last 3 years? What carrier currently insures it and at what premium?
- What's the average days-on-market for RENTAL listings here right now (not sales)? A rising rental-DOM trend means longer vacancies and softer asking-rent achievability than the comps imply.
- What's the recent tenant-quality profile in this submarket — average credit score on applications, eviction rate, late-payment / NSF rate, and stable-employment percentage? A property-management company in the area should have these aggregated.
- How much new for-sale + rental construction is in the pipeline within 1–3 miles? Heavy new supply typically softens prices + rents 12–24 months out; constrained supply supports both.
CashFlowRE · CFR-J1PCR836K6JCSA
· Data 6 days ago
cashflowre.app · 2026-05-29