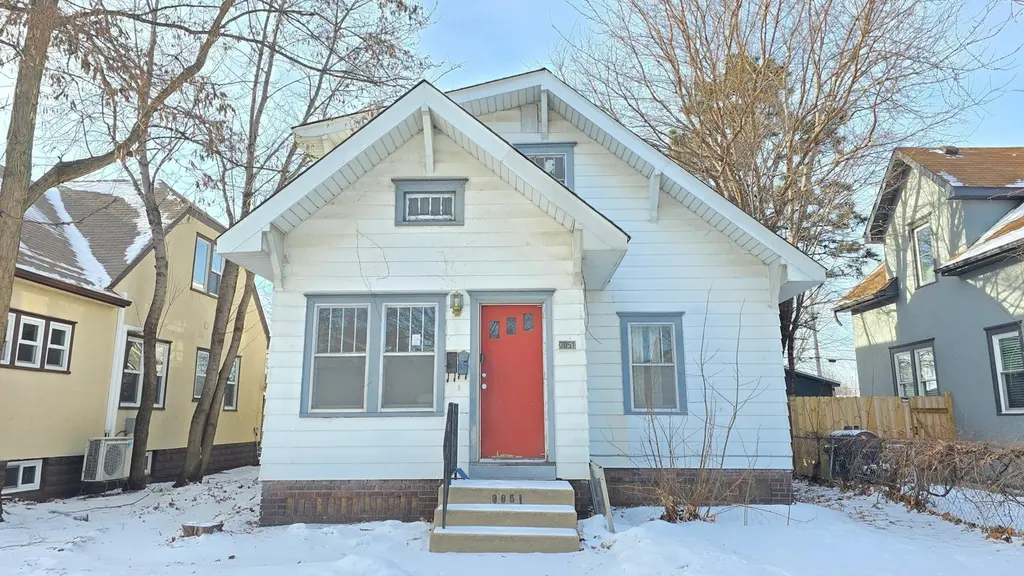
3851 Aldrich Ave N · Minneapolis, MN
Flood risk 1/10 · Minimal
- FEMA flood zone
- X (unshaded)
- Chance of flooding over 30 yrs
- 0.0%
- Est. flood insurance / yr
- $473 – $860
Fire risk 1/10 · Minimal
- Est. fire insurance / yr
- $888 – $1,650
Heat risk 2/10 · Minimal
- Hot days now (above 99°F)
- 7 days/yr
- Hot days in 30 yrs
- 14 days/yr
Wind risk 2/10 · Minimal
- Chance of severe wind over 30 yrs
- —
Air-quality risk 2/10 · Minimal
- Unhealthy air days now
- 1 days/yr
- Unhealthy air days in 30 yrs
- 1 days/yr
Risk factors via First Street. Map © Google.
Why this score? — see what drove the B grade
The composite is a weighted blend of 9 inputs, each scored 0–100. Each bar is that input's sub-score; the figure is the points it added to the 100-point composite (weight × sub-score).
- Cash flow +30.0/30.0
- 1% rule +10.0/10.0
- DSCR +10.0/10.0
- ARV discount +7.5/15.0
- Rent growth +4.1/5.0
- Livability +3.9/5.0
- Schools +3.5/10.0
- Condition / age +2.5/5.0
- Appreciation +0.0/10.0
$140,900
🖨 Deal sheet 📄 Offer letter ✓ Due diligence
Listing remarks
This Webber - Camden duplex is just what you have been looking for. This is an outstanding opportunity to build wealth in Real Estate while owning your own home for less than rent. Enjoy the option to occupy either the one bedroom or 2 bed unit, each with a spacious living room, welcoming kitchen and full bathroom. This is an Upper and Lower unit duplex featuring hardwood floors with white trim and Tudor archways. Enjoy the original built-in china cabinet, exceptional natural light and loads of character. Welcome Home!
Key facts
- 5,227 sq ft lot
- Garage
- Built 1916
Property features AI
Finance
- Other: Property is not owner-occupied; 2 total units (one 1,104 sq ft unit with 2 beds/1 bath; one 1,000 sq ft unit with 1 bed/1 bath)
- Financial info: Owner pays: fuel and trash collection for multi-family financial responsibilities; Tenants pay: fuel and trash collection (tenant/owner pay entries indicate responsibilities)
Exterior
- Parking: Parking available (unit-level parking indicated as 2 for one unit)
- Utilities: City water connected; City sewer connected; Electric with circuit breakers; Natural gas
- Home design: Residential income property — duplex (up and down); Two levels
- Construction: Block and frame construction; Asphalt roof; Foundation area approximately 1,104 (foundation area reported)
- Exterior features: Rear porch; Metal and wood exterior; Public transit within six blocks; Medium tree coverage; Paved streets with public maintenance
Interior
- Kitchen: No specific kitchen appliance details provided
- Bedrooms: 3 bedrooms (includes lower-level bedroom/laundry on lower level noted in laundry features)
- Bathrooms: Multiple full bathrooms (unit breakdown indicates full bathrooms in each unit)
- Heating & cooling: Gravity heating; No central cooling (units listed as having no cooling system)
- Interior features: Full basement; Level topography
- Laundry & utility: Laundry located on the lower level
Neighborhood map
What this means for you Summary
Snapshot
- This is a 3-bed/2.0-bath other listed at $141k.
Deal economics
- At list price, monthly cash flow is $903 ($11k/yr) — positive.
- The deal already cash-flows at list — no discount required.
- Meets the 1% rule at list price ($2k rent vs $141k).
- Cap rate 14.0% vs local median 3.1% in Minneapolis — top-decile yield for the area; either an underpriced asset or a hidden risk that comps aren't pricing in. Stress-test before assuming the spread holds.
Location & tenants
- Location reads 78/100 on livability (#110 in MN, #2,525 nationally) — a middle-class / working-renter tenant base. Strengths: amenities A+, commute A+, housing A+; Watch: cost of living C-, crime F.
- Minneapolis Public School District (urban): math 35% / reading 46% proficiency, ranked #217 of 301 in MN (top 72%) — families likely to look elsewhere, expect single-tenant / working-renter base with shorter leases.
- Market conditions: Rents rising fast (+6.3%/yr); 169 active listings in the ZIP; 7 comparable units currently listed for rent nearby; rentals lingering (median 44d on market — plan ~5-8 weeks vacancy on turnover, expect pricing pressure); 57% of comp listings sitting > 30 days — soft ceiling on asking rent; 4,651 units permitted in Hennepin County in 2024 (2,443 in 5+ unit buildings).
- This rent runs 42% of the median local income ($69k/yr) — at the standard rent-burdened threshold; future hikes will face affordability resistance.
Forward outlook
- Local home prices are declining (-3.0%/yr); year-one equity from $974 of loan paydown is wiped out by about $4k of value loss. Plan a longer hold.
- Hennepin County population projected at +30% by 2050 — long-run rental-demand tailwind backs the buy-and-hold thesis.
- At projected returns (-3.0% appreciation + 6.3% rent growth), your $39k cash investment doubles in ~4 years — after that, you're playing with house money.
Negotiation context
- Only 1 days on market — expect competitive offers; lowballing is unlikely to land.
- 3 sale attempts since 30y ago with the ask held roughly flat each time — persistent listings suggest the price (not the market) is what's stuck; bring a comps-based counter.
- Current owner paid $115k; 23% above their basis — modest negotiation headroom, anchor on the comps not their cost.
Risks & watch-outs
- Watch-outs: built in 1916 — expect roof / HVAC / electrical / plumbing capex.
Questions for the listing agent
- Built in 1916 — when were the roof, HVAC, electrical panel, plumbing, and water heater last replaced?
- Is there a deadline driving the sale (1031 exchange, divorce, estate, relocation)? That informs how much negotiation room exists.
- Crime grade is F in this area — have there been break-ins, vandalism, or insurance claims at this property in the last 3 years? What carrier currently insures it and at what premium?
- What's the average days-on-market for RENTAL listings here right now (not sales)? A rising rental-DOM trend means longer vacancies and softer asking-rent achievability than the comps imply.
- What's the recent tenant-quality profile in this submarket — average credit score on applications, eviction rate, late-payment / NSF rate, and stable-employment percentage? A property-management company in the area should have these aggregated.
- How much new for-sale + rental construction is in the pipeline within 1–3 miles? Heavy new supply typically softens prices + rents 12–24 months out; constrained supply supports both.
Investment metrics
- 1% rule
- 1.69% ✓
- Cap rate
- 13.99%
- Cash-on-cash
- 27.48%
- DSCR
- 2.22
- GRM
- 4.9
CMA / ARV
No comps found within radius.
Projected returns pro-forma
-3.0% appreciation · 6.35% rent growth · sell at horizon
- IRR
- 25.3%
- Equity multiple
- 2.09×
- Total profit
- $43,025
- Equity at exit
- $21,009
- IRR
- 35.0%
- Equity multiple
- 4.75×
- Total profit
- $148,100
- Equity at exit
- $12,182
Cash invested: $39,452 (down + closing). Projections, not guarantees.
Landlord ↔ Tenant lean methodology
- Overall (CITY)
- 34 Tenant-Leaning
- State Minnesota
- 46 Balanced · D+2
- County
- — inherits STATE
- City Minneapolis
- 34 Tenant-Leaning · D+50
ZIP-level market 55412
- Home prices YoY
- -26.9%
- Rents YoY
- 6.3%
- Active inventory
- 169
- Price-to-rent
- 4.9×
Monthly cashflow live
- Estimated rent
- $2,376 high interval (Pro) →
- Mortgage (P&I)
- −$739
- Tax est. 1.5%
- −$176 /mo · $2,114/yr
- Insurance
- −$59
- HOA
- −$0
- Vacancy / Maint / Mgmt
- −$499
- Net cashflow
- $903
Break-even live
UW: 25.0% down · 7.5% · 30yr · 1.5% tax · 5.0% vac · 8.0% maint · 8.0% mgmt
Financing live
Cash to close
- Down payment
- $35,225
- Closing costs
- $4,227
- Reserves months
- —
- Total cash needed
- —
Loan-product check · same deal, 3 products live
Conventional
25% down · 7.5% · 30yr
- Down + closing
- —
- Monthly P&I
- —
- Monthly cashflow
- —
- DSCR
- —
- Eligible?
- —
Personal DTI + credit; lowest rate.
DSCR
20% down · 8.5% · 30yr
- Down + closing
- —
- Monthly P&I
- —
- Monthly cashflow
- —
- DSCR
- —
- Eligible?
- —
No personal income docs; deal must DSCR.
Hard money
10% down · 12.0% · 12mo
- Down + closing
- —
- Monthly P&I
- —
- Monthly cashflow
- —
- DSCR
- —
- Eligible?
- —
Short-term bridge; refi at stabilization.
Rent comps 7 comps
| Address | Beds | Baths | Sqft | Rent | $/sqft | DOM | Units | Dist |
|---|---|---|---|---|---|---|---|---|
| 3935 Fremont Ave N Minneapolis, MN | 4.0 | 1.0 | 1900 | $2,595 | $1.37 | 43d | 1 | 0.32mi |
| 3342 Fremont Ave N Unit 2 Minneapolis, MN | 4.0 | 2.0 | 2000 | $2,200 | $1.10 | 24d | 1 | 0.65mi |
| 4433 N Aldrich Ave Unit 1 Minneapolis, MN | 4.0 | 1.0 | 2300 | $1,895 | $0.82 | 43d | 1 | 0.80mi |
| 3315 James Ave N Minneapolis, MN | 4.0 | 1.0 | 1400 | $2,100 | $1.50 | 4d | 1 | 0.85mi |
| 2643 Lyndale Ave N Minneapolis, MN | 4.0 | 2.0 | 2198 | $750 | $0.34 | 16d | 1 | 1.22mi |
| 2646 Dupont Ave N Unit 2 Minneapolis, MN | 4.0 | 1.0 | 1514 | $2,245 | $1.48 | 43d | 1 | 1.22mi |
| 207 24th Ave NE Minneapolis, MN | 3.0 | 3.0 | 1575 | $2,995 | $1.90 | 43d | 1 | 1.48mi |
Listing history 11 events
-
2026-05-12status Pending
-
2026-05-12$140,900 Active
-
2026-05-10historical
-
2026-03-24historical Contingent - Inspection
-
2026-03-12price $140,900
-
2026-01-20$177,900 Active
-
2019-05-29soldstatus $115,000
-
1996-11-06soldstatus $46,500
-
1996-10-25soldstatus $46,500
-
1996-09-06historical
-
1996-03-25$49,500
ⓘ Source: listings_history table (triggers on properties + properties_extension) + one-shot
backfill from property_details.listing_events for pre-trigger history.
Climate risk First Street
- Flood 1/10 Low FEMA zone X (unshaded) · 0% chance over 30 yrs
- Wildfire 1/10 Low
- Heat 2/10 Low 7 d/yr ≥99°F today · 14 d/yr by 30 yrs out
- Wind 2/10 Low
- Air quality 2/10 Low 1 unhealthy d/yr today · 1 by 30 yrs out
Nearby sold comps map
Loading sold comps map…
Walkable amenities ~0.75 mi
Loading nearby amenities…
Taxation est. · year 1
- Rental income
- $28,515
- − Mortgage interest
- −$7,893
- − Property taxes
- −$2,114
- − Insurance
- −$704
- − Repairs & maintenance
- −$2,281
- − Management
- −$2,281
- − Depreciation
- −$4,099
- Taxable income
- $9,143
- Est. tax owed @ 24.0%
- −$2,194
- After-tax cash flow
- $8,647/yr
For passive investors: Depreciation is non-cash, so a rental often shows a tax loss while cash-flowing — sheltering income. Rental losses are passive: they offset passive income freely, and up to $25,000/yr can offset ordinary (W-2) income if you actively participate and your MAGI is under $100k (phasing out to $0 by $150k); unused losses carry forward. On sale, claimed depreciation is recaptured at up to 25%, and gains may owe capital-gains tax (a 1031 exchange can defer both). Figures are a year-1 estimate at your 24.0% rate — not tax advice; consult a CPA.
Schools (NCES district)
- District
- Minneapolis Public School District
- NCES district ID
- 2721240
- Math proficiency
- 35% ▼ -7.00%
- Reading proficiency
- 46% ▼ -1.00%
- Median HH income
- $50,521
- Composite
- 34.92/100
- National rank
- #5067
- State rank
- #217 of 301 in MN
Livability — Minneapolis
- Score
- 78/100
- State rank
- #110
- US rank
- #2525
Category grades
Schools grade is shown separately in the Schools card above.
Census & demographics
- Census place
- Minneapolis, MN
- County
- Hennepin County · 1,150,272 people
- City population
- 417,555
- Metro
- Minneapolis-St. Paul-Bloomington, MN-WI
- Population (ZIP)
- 24,460
- Household income
- $68,682
- Rent vs Own
- Severe rent burden
- 913.0
Population outlook (Hennepin County) Hauer SSP2
- Today (2025)
- 1,405,227 people
- By 2030
- 1,492,650 · +6.2%
- By 2040
- 1,660,157 · +18.1%
- By 2050
- 1,823,498 · +29.8%
- By 2075
- 2,221,283 · +58.1%
- By 2100
- 2,509,976 · +78.6%
Race, ethnicity, and origin ACS 2023
- Neighborhood character
- Highly diverse neighborhood (Simpson 0.73)
- Race & ethnicity
- White 36% Black 33% Hispanic / Latino 14% Two or more races 12% Asian 8% Native American 1%
- Hispanic origin (detail)
- Mexican 8%
- Common ancestry
- Portuguese 6% Lithuanian 2% Romanian 1%
- Foreign-born
- 12% · Canada
- Languages at home
- 82% English-only · Spanish 9% Other Asian/Pacific 7% Tagalog/Filipino 1%
Political lean MEDSL · Hennepin
- 2024 margin
- Solid D (+42.6) · D 70.2% · R 27.5% · Other 2.3%
- 2008→2024 swing
- +14.0pp toward D · 2008: 28.6pp · 2024: 42.6pp
- All cycles
- 2024: D+42.6 2020: D+43.2 2016: D+35.3 2012: D+27.1 2008: D+28.6
Not yet ingested
- Civics
- —
Market trends
- HPI YoY
- ▼ -109.98%
- Current HPI
- 298.1414
- Rent YoY
- ▲ 6.35%
- Metro
- Minneapolis-St. Paul-Bloomington, MN-WI
- State GDP YoY
- ▲ 2.41%
- F500 in state
- 34
Industry mix (Fortune 500 HQ in MN)
| Industry | F500 HQs | Revenue |
|---|---|---|
| Healthcare | 2 | $407B |
|
||
| Retail | 2 | $150B |
|
||
| Consumer Goods | 2 | $32B |
|
||
| Industrial Machinery | 2 | $6B |
|
||
| Agriculture | 1 | $40B |
|
||
| Healthcare / Medical Devices | 1 | $32B |
|
||
Price history
+184.6% since first listed11 events — show timeline
- 2026-05-12 Pending — NORTHSTARMLS as Distributed by MLS Grid
- 2026-05-12 Listed $140,900 NORTHSTARMLS as Distributed by MLS Grid
- 2026-05-10 Listing Removed — NORTHSTARMLS as Distributed by MLS Grid
- 2026-03-24 Contingent — NORTHSTARMLS as Distributed by MLS Grid
- 2026-03-12 Price Changed $140,900 NORTHSTARMLS as Distributed by MLS Grid
- 2026-01-20 Listed $177,900 NORTHSTARMLS as Distributed by MLS Grid
- 2019-05-29 Sold (Public Records) $115,000 Public Records
- 1996-11-06 Sold (Public Records) $46,500 Public Records
- 1996-10-25 Sold (MLS) $46,500 NORTHSTARMLS as Distributed by MLS Grid
- 1996-09-06 Listing Removed — NORTHSTARMLS as Distributed by MLS Grid
- 1996-03-25 Listed $49,500 NORTHSTARMLS as Distributed by MLS Grid
Property tax history
+13.0%/yrLatest (2025): $10,120 · +53.7% YoY. Source: county tax records.
Cash-flow waterfall
monthlySold comps — $/sqft
last 12 mo · ≤1 miLoading sold comps…