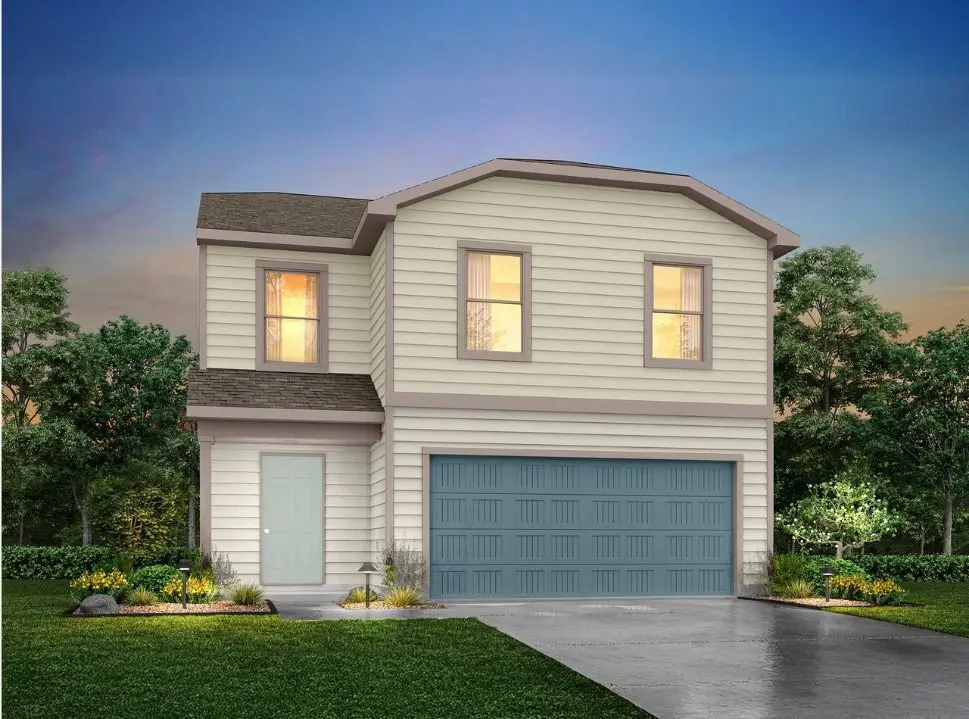
853 Road 590114
Plum Grove, TX 77327
$216,990C+
5 bd · 2.5 ba ·
2,408 sqft ·
Built 2026
· SingleFamily
· Active
· 7 DOM
Cashflow @ list (25.0% down · 7.5%)
Estimated rent
$2,454/mo
Mortgage (P&I)
−$1,056
Tax + insurance
−$336
HOA
−$10
Vac / Maint / Mgmt
−$515
Net cashflow
$537/mo
Annual
$6,444/yr
Cap rate
9.49%
Cash-on-cash
11.43%
DSCR
1.51
1% rule
1.22%
Cash to close
$56,386
Investor read
- This is a 5-bed/2.5-bath single-family listed at $217k. Condition is rated fair.
- At list price, monthly cash flow is $537 ($6k/yr) — positive.
- The deal already cash-flows at list — no discount required.
- Meets the 1% rule at list price ($2k rent vs $217k).
- Only 7 days on market — expect competitive offers; lowballing is unlikely to land.
- Local home prices are declining (-3.0%/yr); year-one equity from $1k of loan paydown is wiped out by about $6k of value loss. Plan a longer hold.
- Location reads 58/100 on livability (#1,206 in TX) — a working-class tenant base; expect higher turnover. Strengths: crime A+, cost of living A+, housing A+; Watch: amenities F, commute F, health & safety F.
- Cleveland ISD (town): math 24% / reading 25% proficiency, ranked #723 of 826 in TX (top 88%) — low school quality limits family demand, transient renter base, plan for 1-2y turnover; 71% free/reduced lunch — lower-income household profile, screen leases tightly.
- Zoned schools: Pine Burr El (691 students, 97% FRL); Santa Fe Middle (915 students, 99% FRL); Cleveland H S (math 30% / reading 32%, grade F, #1,077 of 1,632 statewide, top 66%, 3,310 students, 92% FRL) — zoned schools average 96% FRL vs 71% district-wide (25 pts higher); higher-poverty schools than district average — tighter screening recommended.
- Market conditions: Rents rising fast (+4.0%/yr); 1578 active listings in the ZIP; 2 comparable units currently listed for rent nearby; 1,321 units permitted in Liberty County in 2024 (0 in 5+ unit buildings).
- Liberty County population projected at +24% by 2050 — long-run rental-demand tailwind backs the buy-and-hold thesis.
- 2 sale attempts with the ask held roughly flat each time — persistent listings suggest the price (not the market) is what's stuck; bring a comps-based counter.
- At projected returns (-3.0% appreciation + 4.0% rent growth), your $56k cash investment doubles in ~9 years — after that, you're playing with house money.
- Cap rate 9.5% vs local median 5.0% in Plum Grove — top-decile yield for the area; either an underpriced asset or a hidden risk that comps aren't pricing in. Stress-test before assuming the spread holds.
- At $2,454/mo this rent would consume 47% of the median local household income ($62k/yr) (locally 437% of renters already pay >50% of income on rent) — very limited rent-growth headroom before tenants either downsize or default.
Questions for listing agent
- Have any recent inspections been done? Can we get a copy of the seller's disclosures and any deferred-maintenance estimates?
- What does the HOA fee cover, when was the last increase, and are there any pending special assessments or reserve-fund shortfalls?
- Is there a deadline driving the sale (1031 exchange, divorce, estate, relocation)? That informs how much negotiation room exists.
- Schools are F-rated, which usually means shorter tenancies and higher turnover. Who's the typical renter profile here, and what's been the actual vacancy rate?
- What's the average days-on-market for RENTAL listings here right now (not sales)? A rising rental-DOM trend means longer vacancies and softer asking-rent achievability than the comps imply.
- What's the recent tenant-quality profile in this submarket — average credit score on applications, eviction rate, late-payment / NSF rate, and stable-employment percentage? A property-management company in the area should have these aggregated.
- How much new for-sale + rental construction is in the pipeline within 1–3 miles? Heavy new supply typically softens prices + rents 12–24 months out; constrained supply supports both.
Repairs flagged (vision-AI assessment)
- Major: Kitchen cabinets — Significant wear and tear, likely requiring replacement.
- Major: Bathroom fixtures — Outdated and in need of replacement.
- Major: Flooring — Old and in poor condition, likely requiring replacement.
- Major: Interior walls — Paint chipping and peeling, likely requiring repainting.
CashFlowRE · CFR-J1RD7RA3BF6MF6
· Data 9 h ago
cashflowre.app · 2026-05-29