 🏗️ New Construction
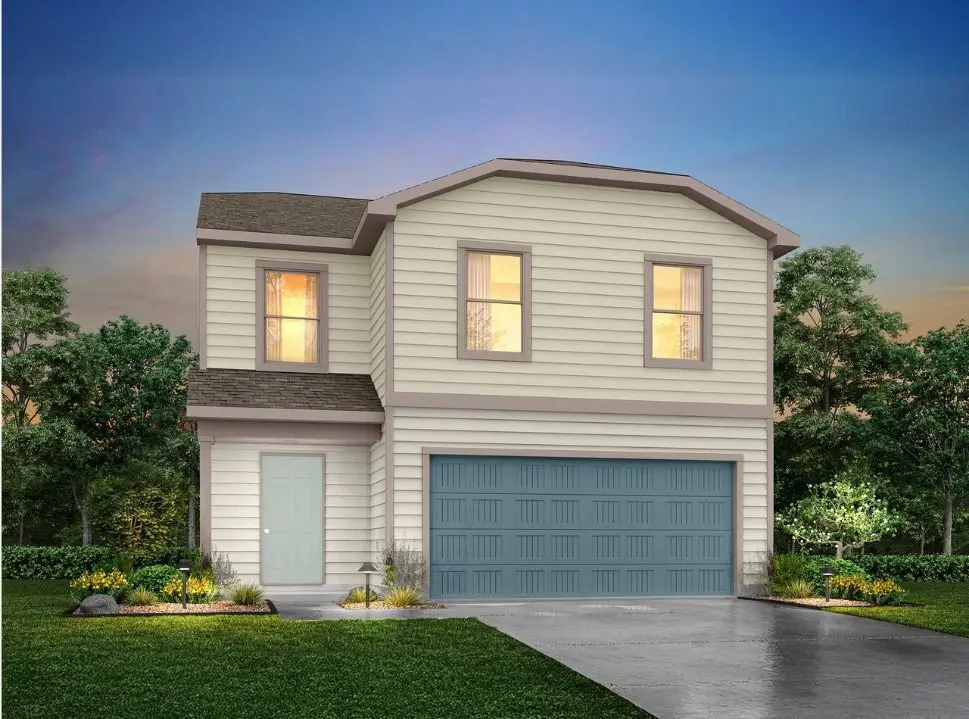
853 Road 590114 · Plum Grove, TX
Flood risk No data
- FEMA flood zone
- —
- Chance of flooding over 30 yrs
- —
- Est. flood insurance / yr
- —
Fire risk No data
- Est. fire insurance / yr
- —
Heat risk No data
- Hot days now (above threshold)
- —
- Hot days in 30 yrs
- —
Wind risk No data
- Chance of severe wind over 30 yrs
- —
Air-quality risk No data
- Unhealthy air days now
- —
- Unhealthy air days in 30 yrs
- —
Risk factors via First Street. Map © Google.
Why this score? — see what drove the C+ grade
The composite is a weighted blend of 9 inputs, each scored 0–100. Each bar is that input's sub-score; the figure is the points it added to the 100-point composite (weight × sub-score).
- Cash flow +26.6/30.0
- DSCR +9.1/10.0
- ARV discount +7.5/15.0
- 1% rule +7.2/10.0
- Rent growth +3.5/5.0
- Livability +2.9/5.0
- Condition / age +2.2/5.0
- Schools +2.1/10.0
- Appreciation +0.0/10.0
$216,990
🖨 Deal sheet (PDF) 📄 Offer letter ✓ Due diligence
Listing remarks MLS
Model 2408 A1 - Big Bend
Key facts
- 4,791 sq ft lot
- 2 garage spots
- Built 2026
Property features AI
Finance
- HOA & community: Houston El Norte POA with an annual fee of $120
Exterior
- Parking: Attached 2-car garage
- Utilities: Public water; Public sewer; Electric service
- Home design: Residential property; New construction (2026); Slab foundation
- Construction: Built in 2026; Wood siding; Composition roof; Slab foundation
- Exterior features: Subdivision lot
Interior
- Kitchen: Electric oven; Electric range
- Bedrooms: Living room on the first floor; First-floor bedroom (12 x 12'); Second-floor bedroom (11 x 14'); Second-floor bedroom (11 x 12'); Second-floor bedroom (13 x 10'); Second-floor primary bedroom (15 x 16')
- Flooring: Carpet; Laminate
- Bathrooms: 2 full bathrooms; 1 half bathroom
- Heating & cooling: Central heating (electric); Central air (electric)
- Interior features: Kitchen/family room combo; Primary bathroom with soaking tub and tub/shower; Vanity
- Laundry & utility: Washer hookup; Electric dryer hookup
Neighborhood map
What this means for you Summary
Snapshot
- This is a 5-bed/2.5-bath single-family listed at $217k. Condition is rated fair.
Deal economics
- At list price, monthly cash flow is $537 ($6k/yr) — positive.
- The deal already cash-flows at list — no discount required.
- Meets the 1% rule at list price ($2k rent vs $217k).
- Cap rate 9.5% vs local median 5.0% in Plum Grove — top-decile yield for the area; either an underpriced asset or a hidden risk that comps aren't pricing in. Stress-test before assuming the spread holds.
Location & tenants
- Location reads 58/100 on livability (#1,206 in TX) — a working-class tenant base; expect higher turnover. Strengths: crime A+, cost of living A+, housing A+; Watch: amenities F, commute F, health & safety F.
- Cleveland ISD (town): math 24% / reading 25% proficiency, ranked #723 of 826 in TX (top 88%) — low school quality limits family demand, transient renter base, plan for 1-2y turnover; 71% free/reduced lunch — lower-income household profile, screen leases tightly.
- Zoned schools: Pine Burr El (691 students, 97% FRL); Santa Fe Middle (915 students, 99% FRL); Cleveland H S (math 30% / reading 32%, grade F, #1,077 of 1,632 statewide, top 66%, 3,310 students, 92% FRL) — zoned schools average 96% FRL vs 71% district-wide (25 pts higher); higher-poverty schools than district average — tighter screening recommended.
- Market conditions: Rents rising fast (+4.0%/yr); 1574 active listings in the ZIP; 2 comparable units currently listed for rent nearby; 1,321 units permitted in Liberty County in 2024 (0 in 5+ unit buildings).
- At $2,454/mo this rent would consume 47% of the median local household income ($62k/yr) (locally 437% of renters already pay >50% of income on rent) — very limited rent-growth headroom before tenants either downsize or default.
Forward outlook
- Local home prices are declining (-3.0%/yr); year-one equity from $1k of loan paydown is wiped out by about $6k of value loss. Plan a longer hold.
- Liberty County population projected at +24% by 2050 — long-run rental-demand tailwind backs the buy-and-hold thesis.
- At projected returns (-3.0% appreciation + 4.0% rent growth), your $56k cash investment doubles in ~9 years — after that, you're playing with house money.
Negotiation context
- Only 4 days on market — expect competitive offers; lowballing is unlikely to land.
- 2 sale attempts with the ask held roughly flat each time — persistent listings suggest the price (not the market) is what's stuck; bring a comps-based counter.
Questions for the listing agent
- Have any recent inspections been done? Can we get a copy of the seller's disclosures and any deferred-maintenance estimates?
- What does the HOA fee cover, when was the last increase, and are there any pending special assessments or reserve-fund shortfalls?
- Is there a deadline driving the sale (1031 exchange, divorce, estate, relocation)? That informs how much negotiation room exists.
- Schools are F-rated, which usually means shorter tenancies and higher turnover. Who's the typical renter profile here, and what's been the actual vacancy rate?
- What's the average days-on-market for RENTAL listings here right now (not sales)? A rising rental-DOM trend means longer vacancies and softer asking-rent achievability than the comps imply.
- What's the recent tenant-quality profile in this submarket — average credit score on applications, eviction rate, late-payment / NSF rate, and stable-employment percentage? A property-management company in the area should have these aggregated.
- How much new for-sale + rental construction is in the pipeline within 1–3 miles? Heavy new supply typically softens prices + rents 12–24 months out; constrained supply supports both.
Investment metrics
- 1% rule
- 1.22% ✓
- Cap rate
- 9.49%
- Cash-on-cash
- 11.43%
- DSCR
- 1.51
- GRM
- 6.8
CMA / ARV
- ARV (median comp)
- $201,380
- List price
- $216,990
- Delta
- 7.75%
- Verdict
- FAIR
- Comps
- 15 within 1.0 mi
Show comp detail 3 sales within ~0.75 mi
| Address | Dist | Beds/Ba | Sqft | Sold | Price | $/sf | Match |
|---|---|---|---|---|---|---|---|
| 728 Road 5714 | 0.33mi | 5/2.5 | 2,408 (0%) | 15mo | $206,990 | $86 | 72 |
| 287 Road 5821 | 0.51mi | 5/3.0 | 2,600 (+8%) | 17mo | $236,990 | $91 | 47 |
| 222 Rd 5821 | 0.55mi | 4/2.5 (-1) | 2,203 (-8%) | 18mo | $223,990 | $102 | 40 |
Match score weights: distance 35% · size 25% · config 20% · recency 20%. Top-matched comps best support the ARV.
Projected returns pro-forma
-3.0% appreciation · 4.0% rent growth · sell at horizon
- IRR
- 1.9%
- Equity multiple
- 1.07×
- Total profit
- $4,105
- Equity at exit
- $30,026
- IRR
- 12.5%
- Equity multiple
- 2.03×
- Total profit
- $58,231
- Equity at exit
- $17,412
Cash invested: $56,386 (down + closing). Projections, not guarantees.
Landlord ↔ Tenant lean methodology
- Overall (STATE)
- 87 Strongly Landlord-Friendly
- State Texas
- 87 Strongly Landlord-Friendly · R+5
- County
- — inherits STATE
- City
- — inherits STATE
ZIP-level market 77327
- Home prices YoY
- -5.2%
- Rents YoY
- 4.0%
- Active inventory
- 1574
- Price-to-rent
- 7.4×
Monthly cashflow live
- Estimated rent
- $2,454 medium interval (Pro) →
- Mortgage (P&I)
- −$1,056
- Tax est. 1.5%
- −$252 /mo · $3,021/yr
- Insurance
- −$84
- HOA
- −$10
- Vacancy / Maint / Mgmt
- −$515
- Net cashflow
- $537
Break-even live
Sensitivity live
| Price | -10% $676 | -5% $607 | +0% $537 | +5% $467 | +10% $398 |
|---|---|---|---|---|---|
| Rent | -10% $343 | -5% $440 | +0% $537 | +5% $634 | +10% $731 |
| Rate | -1.0pp $638 | -0.5pp $588 | base $537 | +0.5pp $485 | +1.0pp $432 |
UW: 25.0% down · 7.5% · 30yr · 1.5% tax · 5.0% vac · 8.0% maint · 8.0% mgmt
Financing live
Cash to close
- Down payment
- $50,345
- Closing costs
- $6,041
- Reserves months
- —
- Total cash needed
- —
Loan-product check · same deal, 3 products live
Conventional
25% down · 7.5% · 30yr
- Down + closing
- —
- Monthly P&I
- —
- Monthly cashflow
- —
- DSCR
- —
- Eligible?
- —
Personal DTI + credit; lowest rate.
DSCR
20% down · 8.5% · 30yr
- Down + closing
- —
- Monthly P&I
- —
- Monthly cashflow
- —
- DSCR
- —
- Eligible?
- —
No personal income docs; deal must DSCR.
Hard money
10% down · 12.0% · 12mo
- Down + closing
- —
- Monthly P&I
- —
- Monthly cashflow
- —
- DSCR
- —
- Eligible?
- —
Short-term bridge; refi at stabilization.
Rent comps 2 comps
| Address | Beds | Baths | Sqft | Rent | $/sqft | DOM | Units | Dist |
|---|---|---|---|---|---|---|---|---|
| 662 Road 590110 Cleveland, TX | 4.0 | 2.0 | 1600 | $2,200 | $1.38 | 13d | 1 | 0.13mi |
| 287 Road 5821 Cleveland, TX | 5.0 | 3.0 | 2676 | $2,000 | $0.75 | 8d | 1 | 0.54mi |
HOA detail
- Monthly dues
- $10 · $120/yr
Listing history 15 events
-
2026-06-18days on market $216,990 Active 4 DOM
-
2026-06-17days on market $216,990 Active 3 DOM
Show marketing remark (24 chars)
Model 2408 A1 - Big Bend
-
2026-06-16days on market $216,990 Active 2 DOM
-
2026-06-15days on market $216,990 Active 1 DOM
-
2026-06-13days on market $216,990 Active 40 DOM
-
2026-06-09days on market $216,990 Active 36 DOM
-
2026-06-08days on market $216,990 Active 35 DOM
-
2026-06-07days on market $216,990 Active 34 DOM
-
2026-06-04days on market $216,990 Active 31 DOM
-
2026-06-03days on market $216,990 Active 30 DOM
-
2026-06-02days on market $216,990 Active 29 DOM
-
2026-06-01days on market $216,990 Active 28 DOM
-
2026-05-31days on market $216,990 Active 27 DOM
-
2026-05-14price $224,990 24-char remark
Show marketing remark (24 chars)
Model 2408 A1 - Big Bend
-
2026-05-04$228,990 Active 24-char remark
Show marketing remark (24 chars)
Model 2408 A1 - Big Bend
ⓘ Source: listings_history table (triggers on properties + properties_extension) + one-shot
backfill from property_details.listing_events for pre-trigger history.
Nearby sold comps map
Loading sold comps map…
Walkable amenities ~0.75 mi
Loading nearby amenities…
Taxation est. · year 1
- Rental income
- $29,448
- − Mortgage interest
- −$11,280
- − Property taxes
- −$3,021
- − Insurance
- −$1,007
- − Repairs & maintenance
- −$2,356
- − Management
- −$2,356
- − HOA
- −$120
- − Depreciation
- −$5,858
- Taxable income
- $3,450
- Est. tax owed @ 24.0%
- −$828
- After-tax cash flow
- $5,616/yr
For passive investors: Depreciation is non-cash, so a rental often shows a tax loss while cash-flowing — sheltering income. Rental losses are passive: they offset passive income freely, and up to $25,000/yr can offset ordinary (W-2) income if you actively participate and your MAGI is under $100k (phasing out to $0 by $150k); unused losses carry forward. On sale, claimed depreciation is recaptured at up to 25%, and gains may owe capital-gains tax (a 1031 exchange can defer both). Figures are a year-1 estimate at your 24.0% rate — not tax advice; consult a CPA.
Condition & rehab AI · 0 photos
The home requires significant updates to its kitchen, bathrooms, and interior, as well as landscaping improvements, to increase its resale and rental value.
Repairs flagged
- Major Kitchen cabinets — Significant wear and tear, likely requiring replacement.
- Major Bathroom fixtures — Outdated and in need of replacement.
- Major Flooring — Old and in poor condition, likely requiring replacement.
- Major Interior walls — Paint chipping and peeling, likely requiring repainting.
Value-add opportunities
- Resale New kitchen cabinets and countertops — Modernizing the kitchen will significantly enhance the home's appeal to potential buyers.
- Resale New flooring in kitchen and bathrooms — Replacing old flooring will improve the home's condition and make it more attractive to buyers.
- Resale Painting interior walls — Fresh paint will make the interior look more inviting and modern.
- Resale Upgrading bathroom fixtures — Modern fixtures will make the bathrooms more appealing and functional.
- Both Landscaping and curb appeal improvements — Enhancing the exterior will improve the home's curb appeal and make it more attractive to both buyers and renters.
Renovation cost estimate screening
| Repair item | Severity | Est. cost |
|---|---|---|
| Kitchen cabinets · Significant wear and tear, likely requiring replacement. | Major | $15,000–50,000 |
| Bathroom fixtures · Outdated and in need of replacement. | Major | $15,000–50,000 |
| Flooring · Old and in poor condition, likely requiring replacement. | Major | $15,000–50,000 |
| Interior walls · Paint chipping and peeling, likely requiring repainting. | Major | $15,000–50,000 |
| Total estimated repair cost · 4 items | $60,000–200,000 |
Value-add ROI direction
- Resale New kitchen cabinets and countertops — Modernizing the kitchen will significantly enhance the home's appeal to potential buyers. ↑
- Resale New flooring in kitchen and bathrooms — Replacing old flooring will improve the home's condition and make it more attractive to buyers. ↑
- Resale Painting interior walls — Fresh paint will make the interior look more inviting and modern. ↑
- Resale Upgrading bathroom fixtures — Modern fixtures will make the bathrooms more appealing and functional. ↑
- Both Landscaping and curb appeal improvements — Enhancing the exterior will improve the home's curb appeal and make it more attractive to both buyers and renters. ↑
ⓘ Cost ranges are severity-bucket heuristics (US national rule-of-thumb). Get contractor quotes + a written scope before underwriting a rehab budget.
Schools (NCES district)
- District
- Cleveland ISD
- NCES district ID
- 4814370
- Math proficiency
- 24% ▼ -13.00%
- Reading proficiency
- 25% ▼ -4.00%
- Median HH income
- $39,173
- Composite
- 20.61/100
- National rank
- #8549
- State rank
- #723 of 826 in TX
Livability — Plum Grove
- Score
- 58/100
- State rank
- #1206
- US rank
- #21049
Category grades
Schools grade is shown separately in the Schools card above.
Census & demographics
- County
- Liberty County · 82,189 people
- Metro
- Houston-The Woodlands-Sugar Land, TX
- Population (ZIP)
- 42,685
- Household income
- $62,219
- Rent vs Own
- Severe rent burden
- 437.0
Population outlook (Liberty County) Hauer SSP2
- Today (2025)
- 87,956 people
- By 2030
- 92,161 · +4.8%
- By 2040
- 100,784 · +14.6%
- By 2050
- 109,471 · +24.5%
- By 2075
- 133,470 · +51.7%
- By 2100
- 147,372 · +67.6%
Race, ethnicity, and origin ACS 2023
- Neighborhood character
- Diverse neighborhood (Simpson 0.57)
- Race & ethnicity
- Hispanic / Latino 54% White 36% Two or more races 18% Black 8% Native American 2%
- Hispanic origin (detail)
- Mexican 42%
- Common ancestry
- Lithuanian 2% Serbian 1% Slovak 0%
- Foreign-born
- 22% · Canada
- Languages at home
- 51% English-only · Spanish 48%
Political lean MEDSL · Liberty
- 2024 margin
- Solid R (+61.6) · D 19.0% · R 80.6%
- 2008→2024 swing
- -17.9pp toward R · 2008: -43.7pp · 2024: -61.6pp
- All cycles
- 2024: R+61.6 2020: R+59.7 2016: R+58.0 2012: R+53.3 2008: R+43.7
Not yet ingested
- Civics
- —
Market trends
- HPI YoY
- ▼ -12.39%
- Current HPI
- 224.9222
- Rent YoY
- ▲ 4.00%
- Metro
- Houston-The Woodlands-Sugar Land, TX
- State GDP YoY
- ▲ 3.95%
- F500 in state
- 110
Industry mix (Fortune 500 HQ in TX)
| Industry | F500 HQs | Revenue |
|---|---|---|
| Energy | 16 | $1,198B |
|
||
| Technology | 5 | $198B |
|
||
| Engineering / Construction | 4 | $72B |
|
||
| Energy Services | 3 | $60B |
|
||
| Utilities | 3 | $41B |
|
||
| Healthcare | 2 | $330B |
|
||
Price history
-7.0% since first listed5 events — show timeline
- 2026-06-17 Price Changed $212,990 Zillow
- 2026-06-14 Listed $216,990 HARMLS
- 2026-05-22 Price Changed $216,990 Zillow
- 2026-05-14 Price Changed $224,990 Zillow
- 2026-05-04 Listed $228,990 Zillow
Cash-flow waterfall
monthlySold comps — $/sqft
last 12 mo · ≤1 miLoading sold comps…