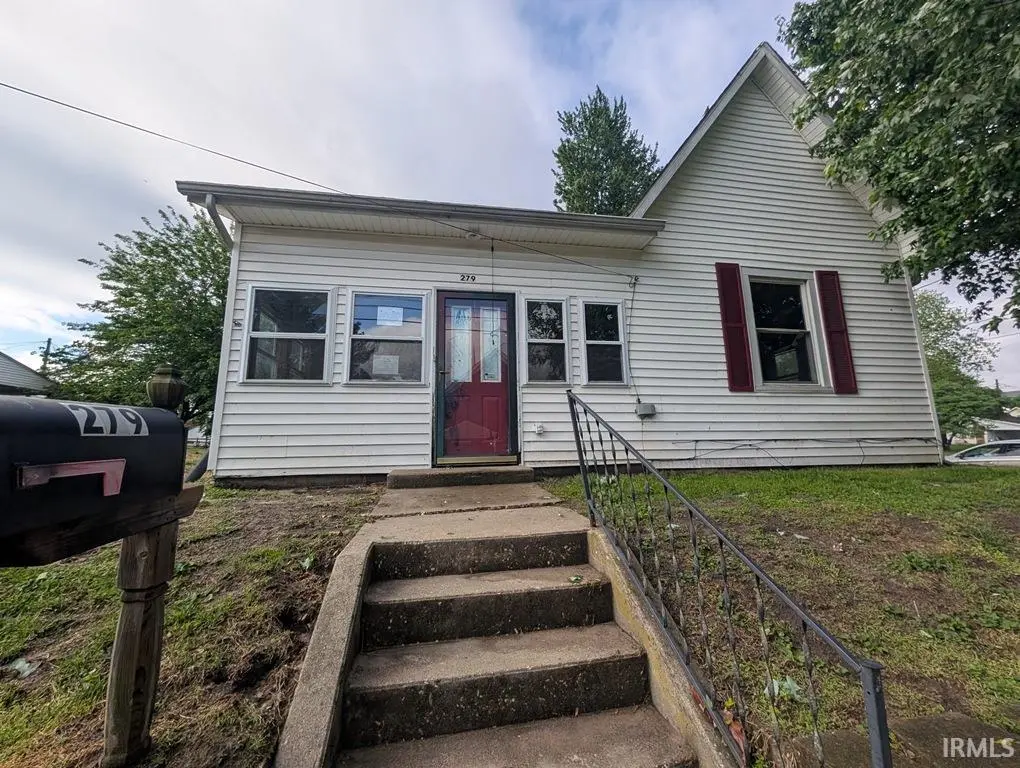
279 W Spring St
Bloomfield, IN 47424
$48,000B
2 bd · 1.0 ba ·
1,026 sqft ·
Built 1960
· SingleFamily
· Active
· 43 DOM
Cashflow @ list (25.0% down · 7.5%)
Estimated rent
$850/mo
Mortgage (P&I)
−$252
Tax + insurance
−$53
HOA
−$0
Vac / Maint / Mgmt
−$178
Net cashflow
$367/mo
Annual
$4,401/yr
Cap rate
15.46%
Cash-on-cash
32.75%
DSCR
2.46
1% rule
1.77%
Cash to close
$13,440
Investor read
- This is a 2-bed/1.0-bath single-family listed at $48k.
- At list price, monthly cash flow is $367 ($4k/yr) — positive.
- The deal already cash-flows at list — no discount required.
- Meets the 1% rule at list price ($850 rent vs $48k).
- It's been on market 43 days — a 3% lower offer ($47k) is reasonable based on typical stale-listing flexibility.
- Recommended offer: $47k (3.0% below list) — sets the bar for market timing.
- Local home prices are declining (-2.8%/yr); year-one equity from $332 of loan paydown is wiped out by about $1k of value loss. Plan a longer hold.
- Location reads 73/100 on livability (#96 in IN) — a middle-class / working-renter tenant base. Strengths: crime A+, cost of living A+, housing A+; Watch: amenities F, commute F.
- Bloomfield School District (town): math 33% / reading 41% proficiency, ranked #169 of 301 in IN (top 56%) — families likely to look elsewhere, expect single-tenant / working-renter base with shorter leases.
- Zoned schools: Bloomfield Elementary School (math 30% / reading 34%, grade F, #652 of 994 statewide, top 68%, 457 students, 51% FRL); Bloomfield Middle School (168 students, 51% FRL); Bloomfield High School (math 37% / reading 52%, grade F, #169 of 369 statewide, top 51%, 233 students, 40% FRL) — zoned schools average 47% FRL vs 32% district-wide (15 pts higher); higher-poverty schools than district average — tighter screening recommended.
- Market conditions: 53 active listings in the ZIP; 1 comparable units currently listed for rent nearby.
- Greene County population projected at -22% by 2050 — secular population decline; favor cash flow + early exit over multi-decade hold.
- 2 sale attempts since 8y ago with the ask held roughly flat each time — persistent listings suggest the price (not the market) is what's stuck; bring a comps-based counter.
- At projected returns (-2.8% appreciation + 3.0% rent growth), your $13k cash investment doubles in ~4 years — after that, you're playing with house money.
Questions for listing agent
- It's been on market 43 days. Have you received any prior offers? Is the seller open to a 3% concession, seller financing, or rate buy-down credit?
- Built in 1960 — when were the roof, HVAC, electrical panel, plumbing, and water heater last replaced?
- Is there a deadline driving the sale (1031 exchange, divorce, estate, relocation)? That informs how much negotiation room exists.
- Schools are D-rated, which usually means shorter tenancies and higher turnover. Who's the typical renter profile here, and what's been the actual vacancy rate?
- What's the average days-on-market for RENTAL listings here right now (not sales)? A rising rental-DOM trend means longer vacancies and softer asking-rent achievability than the comps imply.
- What's the recent tenant-quality profile in this submarket — average credit score on applications, eviction rate, late-payment / NSF rate, and stable-employment percentage? A property-management company in the area should have these aggregated.
- How much new for-sale + rental construction is in the pipeline within 1–3 miles? Heavy new supply typically softens prices + rents 12–24 months out; constrained supply supports both.
CashFlowRE · CFR-J330JS1SRN08F3
· Data 2 days ago
cashflowre.app · 2026-05-29