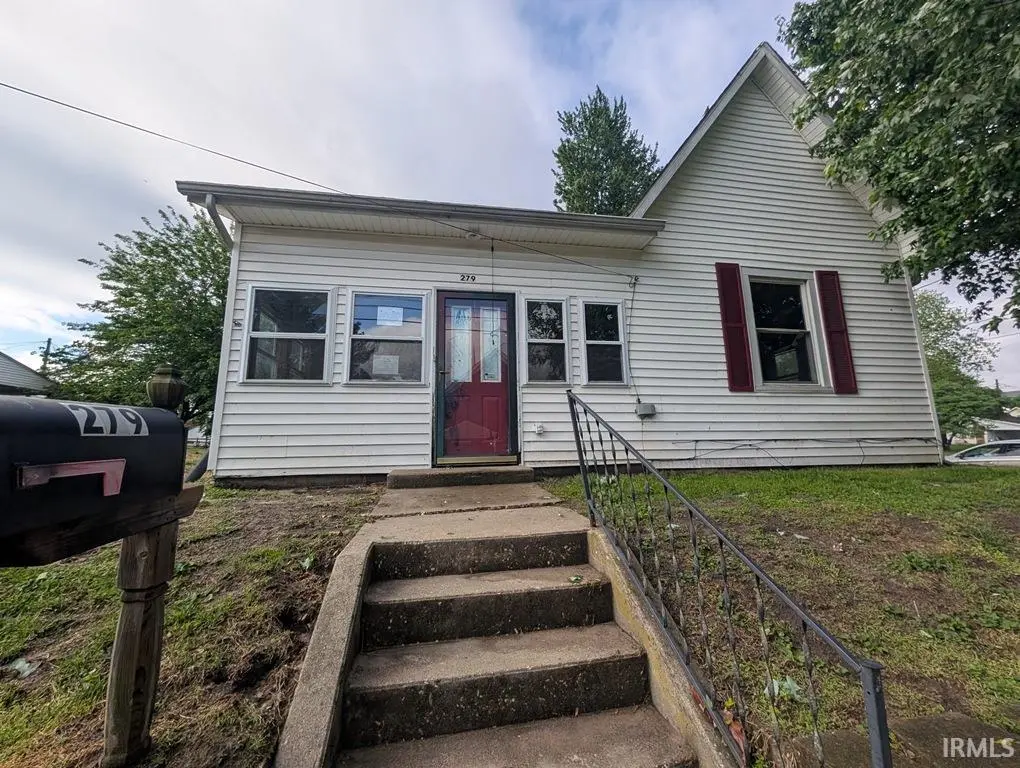
279 W Spring St · Bloomfield, IN
Flood risk 1/10 · Minimal
- FEMA flood zone
- X (unshaded)
- Chance of flooding over 30 yrs
- 0.0%
- Est. flood insurance / yr
- $473 – $860
Fire risk 3/10 · Minor
- Est. fire insurance / yr
- $717 – $1,331
Heat risk 4/10 · Minor
- Hot days now (above 106°F)
- 7 days/yr
- Hot days in 30 yrs
- 18 days/yr
Wind risk 2/10 · Minimal
- Chance of severe wind over 30 yrs
- 0.0%
Air-quality risk 3/10 · Minor
- Unhealthy air days now
- 2 days/yr
- Unhealthy air days in 30 yrs
- 3 days/yr
Risk factors via First Street. Map © Google.
Why this score? — see what drove the B grade
The composite is a weighted blend of 9 inputs, each scored 0–100. Each bar is that input's sub-score; the figure is the points it added to the 100-point composite (weight × sub-score).
- Cash flow +30.0/30.0
- 1% rule +10.0/10.0
- DSCR +10.0/10.0
- ARV discount +7.5/15.0
- Livability +3.7/5.0
- Appreciation +3.6/10.0
- Schools +3.2/10.0
- Rent growth +2.5/5.0
- Condition / age +2.5/5.0
$48,000
🖨 Deal sheet 📄 Offer letter ✓ Due diligence
Listing remarks MLS
Older stately home with updates to include kitchen. Convenient location.
Key facts
- 5,025 sq ft lot
- Built 1960
- Listed 43 days
Property features AI
Finance
- Other: Lot roughly 67 x 75 (about 0.12 acres)
- Financial info: Property tax information not included per instructions
- HOA & community: HOA information not provided
Exterior
- Parking: Parking information not provided
- Security: Security information not provided
- Utilities: Public water; Public sewer
- Home design: Single-family residence; Site-built home; Single-story
- Construction: Vinyl siding; Slab foundation; Built details not provided
- Exterior features: Enclosed porch
Interior
- Kitchen: Kitchen details not provided
- Bedrooms: Bedrooms information not provided
- Flooring: Flooring information not provided
- Bathrooms: 1 full bathroom (on the main level)
- Heating & cooling: Forced air heating; Central air conditioning
- Interior features: Basement present; Total of 5 rooms; Main-level laundry
- Laundry & utility: Laundry located on the main level
Neighborhood map
What this means for you Summary
Snapshot
- This is a 2-bed/1.0-bath single-family listed at $48k.
Deal economics
- At list price, monthly cash flow is $367 ($4k/yr) — positive.
- The deal already cash-flows at list — no discount required.
- Meets the 1% rule at list price ($850 rent vs $48k).
- Recommended offer: $47k (3.0% below list) — sets the bar for market timing.
Location & tenants
- Location reads 73/100 on livability (#96 in IN) — a middle-class / working-renter tenant base. Strengths: crime A+, cost of living A+, housing A+; Watch: amenities F, commute F.
- Bloomfield School District (town): math 33% / reading 41% proficiency, ranked #169 of 301 in IN (top 56%) — families likely to look elsewhere, expect single-tenant / working-renter base with shorter leases.
- Zoned schools: Bloomfield Elementary School (math 30% / reading 34%, grade F, #652 of 994 statewide, top 68%, 457 students, 51% FRL); Bloomfield Middle School (168 students, 51% FRL); Bloomfield High School (math 37% / reading 52%, grade F, #169 of 369 statewide, top 51%, 233 students, 40% FRL) — zoned schools average 47% FRL vs 32% district-wide (15 pts higher); higher-poverty schools than district average — tighter screening recommended.
- Market conditions: 53 active listings in the ZIP; 1 comparable units currently listed for rent nearby.
Forward outlook
- Local home prices are declining (-2.8%/yr); year-one equity from $332 of loan paydown is wiped out by about $1k of value loss. Plan a longer hold.
- Greene County population projected at -22% by 2050 — secular population decline; favor cash flow + early exit over multi-decade hold.
- At projected returns (-2.8% appreciation + 3.0% rent growth), your $13k cash investment doubles in ~4 years — after that, you're playing with house money.
Negotiation context
- It's been on market 43 days — a 3% lower offer ($47k) is reasonable based on typical stale-listing flexibility.
- 2 sale attempts since 8y ago with the ask held roughly flat each time — persistent listings suggest the price (not the market) is what's stuck; bring a comps-based counter.
Questions for the listing agent
- It's been on market 43 days. Have you received any prior offers? Is the seller open to a 3% concession, seller financing, or rate buy-down credit?
- Built in 1960 — when were the roof, HVAC, electrical panel, plumbing, and water heater last replaced?
- Is there a deadline driving the sale (1031 exchange, divorce, estate, relocation)? That informs how much negotiation room exists.
- Schools are D-rated, which usually means shorter tenancies and higher turnover. Who's the typical renter profile here, and what's been the actual vacancy rate?
- What's the average days-on-market for RENTAL listings here right now (not sales)? A rising rental-DOM trend means longer vacancies and softer asking-rent achievability than the comps imply.
- What's the recent tenant-quality profile in this submarket — average credit score on applications, eviction rate, late-payment / NSF rate, and stable-employment percentage? A property-management company in the area should have these aggregated.
- How much new for-sale + rental construction is in the pipeline within 1–3 miles? Heavy new supply typically softens prices + rents 12–24 months out; constrained supply supports both.
Investment metrics
- 1% rule
- 1.77% ✓
- Cap rate
- 15.46%
- Cash-on-cash
- 32.75%
- DSCR
- 2.46
- GRM
- 4.7
CMA / ARV
- ARV (median comp)
- $139,497
- List price
- $48,000
- Delta
- -65.59%
- Verdict
- UNDERPRICED
- Comps
- 20 within 1.0 mi
Show comp detail 9 sales within ~0.75 mi
| Address | Dist | Beds/Ba | Sqft | Sold | Price | $/sf | Match |
|---|---|---|---|---|---|---|---|
| 101 N Harrison St | 0.25mi | 2/1.0 | 1,026 (0%) | 12mo | $125,000 | $122 | 79 |
| 148 N Seminary St | 0.22mi | 2/1.0 | 974 (-5%) | 7mo | $23,000 | $24 | 76 |
| 119 N Seminary St | 0.21mi | 2/1.0 | 988 (-4%) | 22mo | $149,900 | $152 | 66 |
| 240 N Cleveland St | 0.32mi | 2/1.0 | 884 (-14%) | 3mo | $141,500 | $160 | 59 |
| 612 S Lewis St | 0.35mi | 3/1.0 (+1) | 1,100 (+7%) | 9mo | $105,000 | $95 | 59 |
| 635 W Turner St | 0.31mi | 2/1.0 | 1,092 (+6%) | 20mo | $155,000 | $142 | 58 |
| 551 N Washington St | 0.67mi | 2/2.0 | 981 (-4%) | 2mo | $150,000 | $153 | 56 |
| 1012 S Lewis St | 0.53mi | 2/1.0 | 936 (-9%) | 12mo | $130,000 | $139 | 51 |
| 1208 S First St | 0.74mi | 1/1.0 (-1) | 950 (-7%) | 1mo | $35,000 | $37 | 47 |
Match score weights: distance 35% · size 25% · config 20% · recency 20%. Top-matched comps best support the ARV.
Projected returns pro-forma
-2.84% appreciation · 3.0% rent growth · sell at horizon
- IRR
- 28.2%
- Equity multiple
- 2.18×
- Total profit
- $15,901
- Equity at exit
- $7,500
- IRR
- 35.4%
- Equity multiple
- 4.29×
- Total profit
- $44,186
- Equity at exit
- $4,742
Cash invested: $13,440 (down + closing). Projections, not guarantees.
Landlord ↔ Tenant lean methodology
- Overall (STATE)
- 90 Strongly Landlord-Friendly
- State Indiana
- 90 Strongly Landlord-Friendly · R+11
- County
- — inherits STATE
- City
- — inherits STATE
ZIP-level market 47424
- Home prices YoY
- -1.3%
- Active inventory
- 53
- Price-to-rent
- 4.7×
Monthly cashflow live
- Estimated rent
- $850 medium interval (Pro) →
- Mortgage (P&I)
- −$252
- Tax from tax record
- −$33 /mo · $396/yr
- Insurance
- −$20
- HOA
- −$0
- Vacancy / Maint / Mgmt
- −$178
- Net cashflow
- $367
Break-even live
UW: 25.0% down · 7.5% · 30yr · 1.5% tax · 5.0% vac · 8.0% maint · 8.0% mgmt
Financing live
Cash to close
- Down payment
- $12,000
- Closing costs
- $1,440
- Reserves months
- —
- Total cash needed
- —
Loan-product check · same deal, 3 products live
Conventional
25% down · 7.5% · 30yr
- Down + closing
- —
- Monthly P&I
- —
- Monthly cashflow
- —
- DSCR
- —
- Eligible?
- —
Personal DTI + credit; lowest rate.
DSCR
20% down · 8.5% · 30yr
- Down + closing
- —
- Monthly P&I
- —
- Monthly cashflow
- —
- DSCR
- —
- Eligible?
- —
No personal income docs; deal must DSCR.
Hard money
10% down · 12.0% · 12mo
- Down + closing
- —
- Monthly P&I
- —
- Monthly cashflow
- —
- DSCR
- —
- Eligible?
- —
Short-term bridge; refi at stabilization.
Rent comps 1 comps
| Address | Beds | Baths | Sqft | Rent | $/sqft | DOM | Units | Dist |
|---|---|---|---|---|---|---|---|---|
| 207 Lincoln Dr Bloomfield, IN | 1.0 | 1.5 | 800 | $850 | $1.06 | 20d | 1 | 0.30mi |
Listing history 18 events
-
2026-06-18days on market $48,000 Active 43 DOM
-
2026-06-17days on market $48,000 Active 42 DOM
-
2026-06-16days on market $48,000 Active 41 DOM
-
2026-06-15days on market $48,000 Active 40 DOM
-
2026-06-13days on market $48,000 Active 38 DOM
-
2026-06-12days on market $48,000 Active 37 DOM
-
2026-06-09days on market $48,000 Active 34 DOM
-
2026-06-08days on market $48,000 Active 33 DOM
-
2026-06-07days on market $48,000 Active 32 DOM
-
2026-06-07days on market $48,000 Active 31 DOM
-
2026-06-04days on market $48,000 Active 28 DOM
-
2026-06-02days on market $48,000 Active 27 DOM
-
2026-06-01days on market $48,000 Active 26 DOM
-
2026-05-31days on market $48,000 Active 25 DOM
-
2026-05-31days on market $48,000 Active 24 DOM
-
2026-05-06$48,000 Active 415-char remark
-
2020-04-17soldstatus $74,425 72-char remark
Show marketing remark (72 chars)
Older stately home with updates to include kitchen. Convenient location.
-
2018-08-27$71,900 72-char remark
Show marketing remark (72 chars)
Older stately home with updates to include kitchen. Convenient location.
ⓘ Source: listings_history table (triggers on properties + properties_extension) + one-shot
backfill from property_details.listing_events for pre-trigger history.
Tax reassessment forecast IN · Partial reset (capped growth)
- Current annual tax
- $396 · $33/mo
- Projected year-2 tax
- $402 · $34/mo
- Expected delta
- +$6/yr ($0/mo · 1.5%)
ⓘ Screening estimate from a state-policy table — verify with the county assessor before closing.
Climate risk First Street
- Flood 1/10 Low FEMA zone X (unshaded) · 0% chance over 30 yrs
- Wildfire 3/10 Moderate
- Heat 4/10 Moderate 7 d/yr ≥106°F today · 18 d/yr by 30 yrs out
- Wind 2/10 Low 0% chance of damaging wind over 30 yrs
- Air quality 3/10 Moderate 2 unhealthy d/yr today · 3 by 30 yrs out
Nearby sold comps map
Loading sold comps map…
Walkable amenities ~0.75 mi
Loading nearby amenities…
Taxation est. · year 1
- Rental income
- $10,200
- − Mortgage interest
- −$2,689
- − Property taxes
- −$396
- − Insurance
- −$240
- − Repairs & maintenance
- −$816
- − Management
- −$816
- − Depreciation
- −$1,396
- Taxable income
- $3,847
- Est. tax owed @ 24.0%
- −$923
- After-tax cash flow
- $3,478/yr
For passive investors: Depreciation is non-cash, so a rental often shows a tax loss while cash-flowing — sheltering income. Rental losses are passive: they offset passive income freely, and up to $25,000/yr can offset ordinary (W-2) income if you actively participate and your MAGI is under $100k (phasing out to $0 by $150k); unused losses carry forward. On sale, claimed depreciation is recaptured at up to 25%, and gains may owe capital-gains tax (a 1031 exchange can defer both). Figures are a year-1 estimate at your 24.0% rate — not tax advice; consult a CPA.
Schools (NCES district)
- District
- Bloomfield School District
- NCES district ID
- 1800600
- Math proficiency
- 33% ▼ -11.00%
- Reading proficiency
- 41% ▼ -4.00%
- Median HH income
- $50,351
- Composite
- 32.01/100
- National rank
- #5828
- State rank
- #169 of 301 in IN
Livability — Bloomfield
- Score
- 73/100
- State rank
- #96
- US rank
- #5394
Category grades
Schools grade is shown separately in the Schools card above.
Census & demographics
- Census place
- Bloomfield, IN
- Population (ZIP)
- 8,620
Population outlook (Greene County) Hauer SSP2
- Today (2025)
- 30,724 people
- By 2030
- 29,506 · -4.0%
- By 2040
- 26,744 · -13.0%
- By 2050
- 23,879 · -22.3%
- By 2075
- 18,341 · -40.3%
- By 2100
- 13,976 · -54.5%
Race, ethnicity, and origin ACS 2023
- Neighborhood character
- Predominantly White (96%)
- Race & ethnicity
- White 96% Two or more races 2%
- Common ancestry
- Italian 2% Iranian 2% Slovak 2%
- Foreign-born
- 0%
Political lean MEDSL · Greene
- 2024 margin
- Solid R (+53.7) · D 22.4% · R 76.1% · Other 1.6%
- 2008→2024 swing
- -39.2pp toward R · 2008: -14.5pp · 2024: -53.7pp
- All cycles
- 2024: R+53.7 2020: R+52.2 2016: R+53.4 2012: R+31.4 2008: R+14.5
Not yet ingested
- Civics
- —
Market trends
- HPI YoY
- ▼ -2.84%
- Current HPI
- 208.554
- Rent YoY
- —
- Metro
- —
- State GDP YoY
- ▲ 2.90%
- F500 in state
- 18
Industry mix (Fortune 500 HQ in IN)
| Industry | F500 HQs | Revenue |
|---|---|---|
| Industrial Machinery | 2 | $37B |
|
||
| Healthcare | 1 | $177B |
|
||
| Pharmaceuticals | 1 | $45B |
|
||
| Metals / Steel | 1 | $18B |
|
||
| Agriculture | 1 | $17B |
|
||
| Packaging | 1 | $12B |
|
||
Price history
-33.2% since first listed3 events — show timeline
- 2026-05-06 Listed $48,000 IRMLS
- 2020-04-17 Sold (MLS) $74,425 IRMLS
- 2018-08-27 Listed $71,900 IRMLS
Property tax history
+41.9%/yrLatest (2025): $396 · -3.4% YoY. Source: county tax records.
Cash-flow waterfall
monthlySold comps — $/sqft
last 12 mo · ≤1 miLoading sold comps…