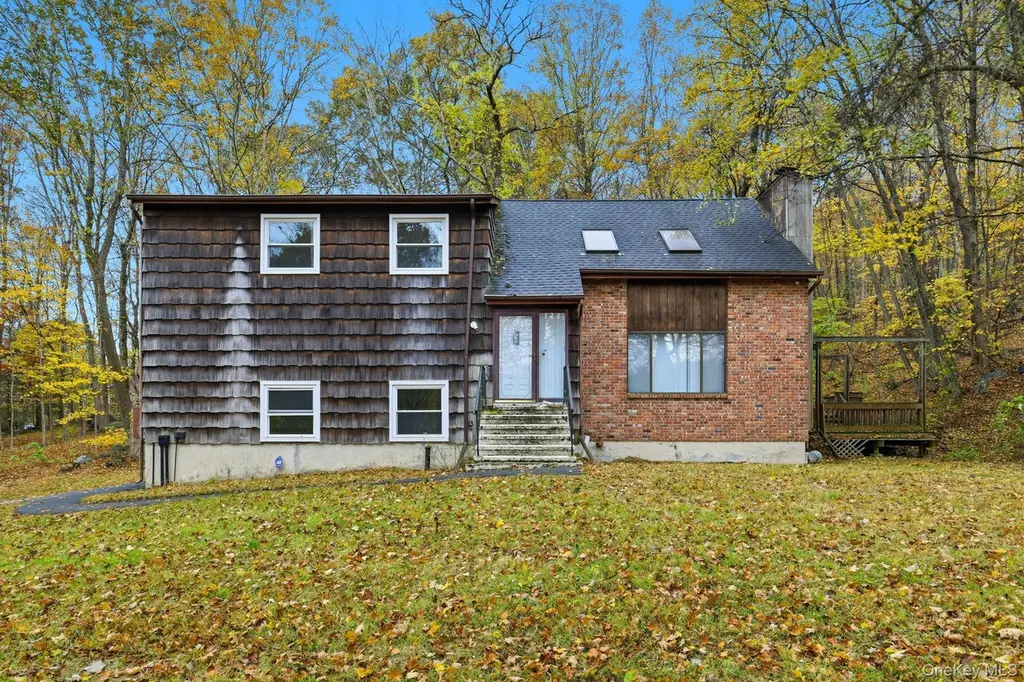
120 South Rd
Shorehaven, NY 12531
$469,000D-
4 bd · 2.0 ba ·
1,608 sqft ·
Built 1981
· SingleFamily
· Pending
· 196 DOM
Cashflow @ list (25.0% down · 7.5%)
Estimated rent
$2,190/mo
Mortgage (P&I)
−$2,459
Tax + insurance
−$972
HOA
−$0
Vac / Maint / Mgmt
−$460
Net cashflow
$-1,701/mo
Annual
$-20,413/yr
Cap rate
1.94%
Cash-on-cash
-15.54%
DSCR
0.31
1% rule
0.47%
Cash to close
$131,320
Investor read
- This is a 4-bed/2.0-bath single-family listed at $469k.
- At list price, monthly cash flow is $-2k ($-20k/yr) — negative.
- To cash-flow at today's rent, offer at most $186k (60.3% below list).
- To meet the 1% rule (rent ≥ 1% of price), the offer needs to be $219k (53.3% below list).
- It's been on market 196 days — a 12% lower offer ($413k) is reasonable based on typical stale-listing flexibility.
- Recommended offer: $186k (60.3% below list) — sets the bar for cash-flow.
- In year one you build about $50k of equity ($3k loan paydown + $47k appreciation (10.0% local appreciation)).
- Location reads: area grade D — affects rentability + tenant quality, not the cash-flow math above.
- Pawling Central School District (rural): math 48% / reading 64% proficiency, ranked #247 of 590 in NY (top 42%) — acceptable for families but not a draw, mixed tenant base, ~2y average lease; only 15% free/reduced lunch — higher-income household profile.
- Zoned schools: Pawling Elementary School (math 57% / reading 67%, grade B, #675 of 2,108 statewide, top 35%, 389 students, 36% FRL); Pawling Middle School (math 24% / reading 59%, grade F, #394 of 729 statewide, top 55%, 342 students, 39% FRL); Pawling High School (math 98% / reading 84%, grade A+, #203 of 1,100 statewide, top 20%, 357 students, 35% FRL) — zoned schools average 37% FRL vs 15% district-wide (22 pts higher); higher-poverty schools than district average — tighter screening recommended.
- Market conditions: 35 active listings in the ZIP; 620 units permitted in Dutchess County in 2024 (242 in 5+ unit buildings).
- Dutchess County population projected at -11% by 2050 — secular population decline; favor cash flow + early exit over multi-decade hold.
- Current owner paid $75k; list at $469k implies a 526% gain — meaningful room to come down on a strong offer.
- By year 2, paydown + projected appreciation supports a ~$81k cash-out refi (75% LTV) — recoverable capital for the next deal without selling this one.
- Climate carrying-cost: major wildfire risk — expect insurance premiums to compound above CPI over the hold.
- Cap rate 1.9% vs local median 1.2% in Shorehaven — top-decile yield for the area; either an underpriced asset or a hidden risk that comps aren't pricing in. Stress-test before assuming the spread holds.
Questions for listing agent
- What do current leases actually rent for vs. the listed asking? Can we see a recent rent roll and the last 12 months of T-12 income?
- It's been on market 196 days. Have you received any prior offers? Is the seller open to a 60% concession, seller financing, or rate buy-down credit?
- Why hasn't it sold? Are there any deal-killer items the seller is aware of (foundation, flood, title, zoning, code violations)?
- Is there a deadline driving the sale (1031 exchange, divorce, estate, relocation)? That informs how much negotiation room exists.
- The area grade is low — what's the realistic commute time and amenity access for the typical tenant pool here? Any planned neighborhood developments (good or bad) we should know about?
- What's the average days-on-market for RENTAL listings here right now (not sales)? A rising rental-DOM trend means longer vacancies and softer asking-rent achievability than the comps imply.
- What's the recent tenant-quality profile in this submarket — average credit score on applications, eviction rate, late-payment / NSF rate, and stable-employment percentage? A property-management company in the area should have these aggregated.
- How much new for-sale + rental construction is in the pipeline within 1–3 miles? Heavy new supply typically softens prices + rents 12–24 months out; constrained supply supports both.
CashFlowRE · CFR-J3A3RV9X733KDS
· Data 4 weeks ago
cashflowre.app · 2026-05-29