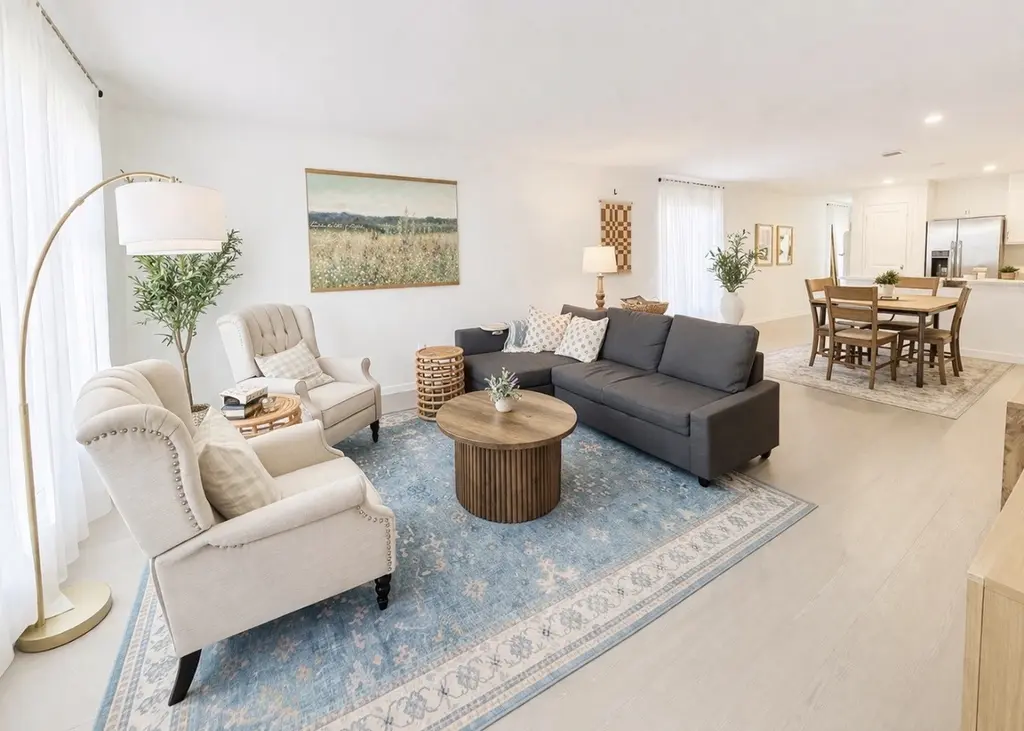
12018 Noble Wood Village Dr
The Woodlands, TX 77354
$2,400C
4 bd · 2.0 ba ·
1,607 sqft ·
Built 2025
· SingleFamily
· Active
· 2 DOM
Cashflow @ list (25.0% down · 7.5%)
Estimated rent
$2,461/mo
Mortgage (P&I)
−$13
Tax + insurance
−$4
HOA
−$0
Vac / Maint / Mgmt
−$517
Net cashflow
$1,927/mo
Annual
$23,130/yr
Cap rate
970.04%
Cash-on-cash
3441.95%
DSCR
154.15
1% rule
102.54%
Cash to close
$672
Investor read
- This is a 4-bed/2.0-bath single-family listed at $2k.
- At list price, monthly cash flow is $2k ($23k/yr) — positive.
- The deal already cash-flows at list — no discount required.
- Meets the 1% rule at list price ($2k rent vs $2k).
- Only 2 days on market — expect competitive offers; lowballing is unlikely to land.
- In year one you build about $257 of equity ($17 loan paydown + $240 appreciation (10.0% local appreciation)).
- Location reads 91/100 on livability (#1 in TX, #47 nationally) — a professional / high-income tenant draw. Strengths: amenities A+, commute A+, employment A+; Watch: cost of living D-.
- Magnolia ISD (rural): math 42% / reading 45% proficiency, ranked #247 of 826 in TX (top 30%) — families likely to look elsewhere, expect single-tenant / working-renter base with shorter leases.
- Zoned schools: Magnolia Parkway El (math 38% / reading 46%, grade F, #1,335 of 4,322 statewide, top 33%, 776 students, 45% FRL); Magnolia H S (math 47% / reading 62%, grade C-, #379 of 1,632 statewide, top 26%, 2,248 students, 31% FRL) — zoned schools at 38% FRL track the district average.
- Market conditions: Rents flat; 1604 active listings in the ZIP; 2 comparable units currently listed for rent nearby; high-income renter base; 13,259 units permitted in Montgomery County in 2024 (1,402 in 5+ unit buildings).
- Montgomery County population projected at +65% by 2050 — long-run rental-demand tailwind backs the buy-and-hold thesis.
- 2 sale attempts with the ask held roughly flat each time — persistent listings suggest the price (not the market) is what's stuck; bring a comps-based counter.
- At projected returns (10.0% appreciation + 0.3% rent growth), your $672 cash investment doubles in ~1 year — after that, you're playing with house money.
- Climate carrying-cost: severe wind risk, 99% chance of damaging wind over 30y; moderate wildfire risk; extreme-heat days projected 7→24/yr by 2055 (HVAC capex compounding) — expect insurance premiums to compound above CPI over the hold.
- Cap rate 970.0% vs local median 2.3% in The Woodlands — top-decile yield for the area; either an underpriced asset or a hidden risk that comps aren't pricing in. Stress-test before assuming the spread holds.
Questions for listing agent
- Is there a deadline driving the sale (1031 exchange, divorce, estate, relocation)? That informs how much negotiation room exists.
- Schools are A-rated — typically a magnet for longer-tenancy family renters. What's the average tenant stay here, and is there a school-zone premium baked into asking?
- What's the average days-on-market for RENTAL listings here right now (not sales)? A rising rental-DOM trend means longer vacancies and softer asking-rent achievability than the comps imply.
- What's the recent tenant-quality profile in this submarket — average credit score on applications, eviction rate, late-payment / NSF rate, and stable-employment percentage? A property-management company in the area should have these aggregated.
- How much new for-sale + rental construction is in the pipeline within 1–3 miles? Heavy new supply typically softens prices + rents 12–24 months out; constrained supply supports both.
CashFlowRE · CFR-J3QWCD1RAF20HM
· Data 2 weeks ago
cashflowre.app · 2026-05-29