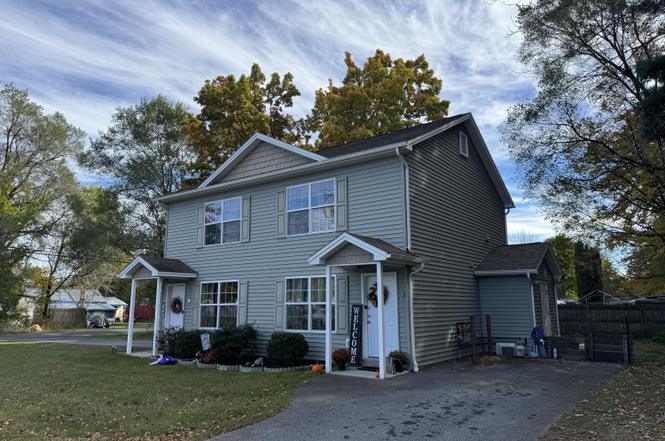
243 Luzerne Rd
West Glens Falls, NY 12804
$319,900C
4 bd · 3.0 ba ·
1,902 sqft ·
Built 2012
· MultiFamily
· Pending
· 8 DOM
Cashflow @ list (25.0% down · 7.5%)
Estimated rent
$3,294/mo
Mortgage (P&I)
−$1,678
Tax + insurance
−$657
HOA
−$0
Vac / Maint / Mgmt
−$692
Net cashflow
$267/mo
Annual
$3,208/yr
Cap rate
7.30%
Cash-on-cash
3.58%
DSCR
1.16
1% rule
1.03%
Cash to close
$89,572
Investor read
- This is a 2 × 2-bed/1.5-bath units multifamily listed at $320k.
- At list price, monthly cash flow is $267 ($3k/yr) — positive. Per door: $134/mo.
- The deal already cash-flows at list — no discount required.
- Meets the 1% rule at list price ($3k rent vs $320k).
- Only 8 days on market — expect competitive offers; lowballing is unlikely to land.
- Local home prices are declining (-3.0%/yr); year-one equity from $2k of loan paydown is wiped out by about $10k of value loss. Plan a longer hold.
- Location reads 71/100 on livability (#388 in NY) — a middle-class / working-renter tenant base. Strengths: employment A+, housing A+, health & safety A+; Watch: crime C-, cost of living C-, amenities F.
- Queensbury Union Free School District (suburban): math 57% / reading 62% proficiency, ranked #230 of 590 in NY (top 39%) — acceptable for families but not a draw, mixed tenant base, ~2y average lease.
- Zoned schools: Queensbury Elementary School (math 67% / reading 62%, grade B, #591 of 2,108 statewide, top 31%, 880 students, 41% FRL); Queensbury Middle School (math 43% / reading 60%, grade C, #256 of 729 statewide, top 35%, 704 students, 36% FRL); Queensbury Senior High School (math 79% / reading 98%, grade A, #299 of 1,100 statewide, top 27%, 980 students, 31% FRL).
- Market conditions: 162 active listings in the ZIP; 180 units permitted in Warren County in 2024 (40 in 5+ unit buildings).
- Warren County population projected at -19% by 2050 — secular population decline; favor cash flow + early exit over multi-decade hold.
- 2 sale attempts with the ask held roughly flat each time — persistent listings suggest the price (not the market) is what's stuck; bring a comps-based counter.
- Current owner paid $158k; list at $320k implies a 103% gain — meaningful room to come down on a strong offer.
- Cap rate 7.3% vs local median 2.4% in West Glens Falls — top-decile yield for the area; either an underpriced asset or a hidden risk that comps aren't pricing in. Stress-test before assuming the spread holds.
Questions for listing agent
- Can we see the unit-by-unit rent roll, current vacancy, and any below-market leases? What's the average tenancy length?
- What capital expenditures (roof, boiler, parking lot, exteriors) have been made in the last 5 years, and what's planned in the next 2?
- Is there a deadline driving the sale (1031 exchange, divorce, estate, relocation)? That informs how much negotiation room exists.
- Schools are F-rated, which usually means shorter tenancies and higher turnover. Who's the typical renter profile here, and what's been the actual vacancy rate?
- What's the average days-on-market for RENTAL listings here right now (not sales)? A rising rental-DOM trend means longer vacancies and softer asking-rent achievability than the comps imply.
- What's the recent tenant-quality profile in this submarket — average credit score on applications, eviction rate, late-payment / NSF rate, and stable-employment percentage? A property-management company in the area should have these aggregated.
- How much new apartment / multifamily construction is in the pipeline within 1–3 miles? Heavy new supply (>2% of stock underway) typically softens rents 12–24 months out; light construction supports rent growth.
CashFlowRE · CFR-J3SJ1V7J4M7X6Y
· Data 4 weeks ago
cashflowre.app · 2026-05-29