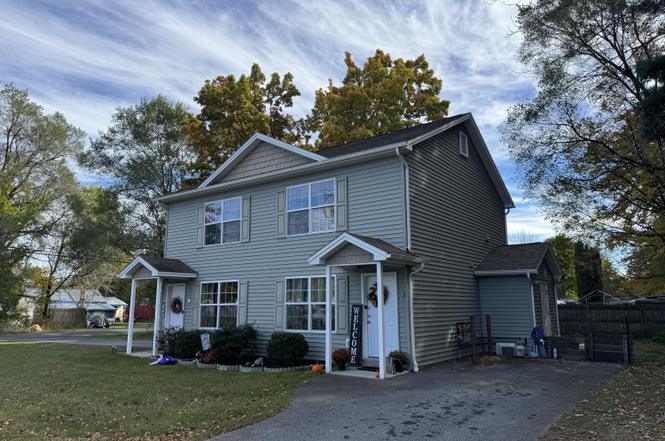
 Duplex
243 Luzerne Rd · West Glens Falls, NY
Flood risk 1/10 · Minimal
- FEMA flood zone
- X
- Chance of flooding over 30 yrs
- 0.0%
- Est. flood insurance / yr
- $507 – $1,088
Fire risk 4/10 · Minor
- Est. fire insurance / yr
- $691 – $1,283
Heat risk 3/10 · Minor
- Hot days now (above 96°F)
- 7 days/yr
- Hot days in 30 yrs
- 16 days/yr
Wind risk 2/10 · Minimal
- Chance of severe wind over 30 yrs
- 3.0%
Air-quality risk 1/10 · Minimal
- Unhealthy air days now
- 0 days/yr
- Unhealthy air days in 30 yrs
- 0 days/yr
Risk factors via First Street. Map © Google.
Why this score? — see what drove the C grade
The composite is a weighted blend of 9 inputs, each scored 0–100. Each bar is that input's sub-score; the figure is the points it added to the 100-point composite (weight × sub-score).
- Cash flow +17.9/30.0
- ARV discount +12.7/15.0
- DSCR +5.6/10.0
- 1% rule +5.3/10.0
- Schools +5.2/10.0
- Livability +3.6/5.0
- Rent growth +2.5/5.0
- Condition / age +2.5/5.0
- Appreciation +0.0/10.0
$319,900
🖨 Deal sheet (PDF) 📄 Offer letter ✓ Due diligence
Multi-family units
County records classify this as Multi-Family (2-4 Unit). Listing-text estimate: 2 units. confirmed
Listing remarks
Like-New Duplex in the Town of Queensbury. Great for owner-occupied or investment opportunity with proven cash flow. Situated on a quiet Corner Lot just outside Glens Falls, this property is easily accessible off Exit 18 of I-87 and just a short drive to Lake George or Saratoga Springs. Both Apartments have the same interior layout w Separate Utilities. Each Apt is approx 900sqft w 2 Bedrooms, 1 Full and 1 Half Bath. Washer/Dryer Hookup on second floor. Separate mechanicals including Central AC, Gas Furnace, Hot Water Heater, Electric and Gas meters. Both units Currently Occupied. Tenant pays for Gas and Electric, Cable and Internet. Landlord pays for Water, Trash Removal and Lawn Maintenan
Key facts
- Central ac
- Gas furnace
- Separate utilities
Tags
Neighborhood map
What this means for you Summary
Snapshot
- This is a 2 × 2-bed/1.5-bath units multifamily listed at $320k.
Deal economics
- At list price, monthly cash flow is $267 ($3k/yr) — positive. Per door: $134/mo.
- The deal already cash-flows at list — no discount required.
- Meets the 1% rule at list price ($3k rent vs $320k).
- Cap rate 7.3% vs local median 2.4% in West Glens Falls — top-decile yield for the area; either an underpriced asset or a hidden risk that comps aren't pricing in. Stress-test before assuming the spread holds.
Location & tenants
- Location reads 71/100 on livability (#388 in NY) — a middle-class / working-renter tenant base. Strengths: employment A+, housing A+, health & safety A+; Watch: crime C-, cost of living C-, amenities F.
- Queensbury Union Free School District (suburban): math 57% / reading 62% proficiency, ranked #230 of 590 in NY (top 39%) — acceptable for families but not a draw, mixed tenant base, ~2y average lease.
- Zoned schools: Queensbury Elementary School (math 67% / reading 62%, grade B, #591 of 2,108 statewide, top 31%, 880 students, 41% FRL); Queensbury Middle School (math 43% / reading 60%, grade C, #256 of 729 statewide, top 35%, 704 students, 36% FRL); Queensbury Senior High School (math 79% / reading 98%, grade A, #299 of 1,100 statewide, top 27%, 980 students, 31% FRL).
- Market conditions: 162 active listings in the ZIP; 180 units permitted in Warren County in 2024 (40 in 5+ unit buildings).
Forward outlook
- Local home prices are declining (-3.0%/yr); year-one equity from $2k of loan paydown is wiped out by about $10k of value loss. Plan a longer hold.
- Warren County population projected at -19% by 2050 — secular population decline; favor cash flow + early exit over multi-decade hold.
Negotiation context
- Only 8 days on market — expect competitive offers; lowballing is unlikely to land.
- 2 sale attempts with the ask held roughly flat each time — persistent listings suggest the price (not the market) is what's stuck; bring a comps-based counter.
- Current owner paid $158k; list at $320k implies a 103% gain — meaningful room to come down on a strong offer.
Questions for the listing agent
- Can we see the unit-by-unit rent roll, current vacancy, and any below-market leases? What's the average tenancy length?
- What capital expenditures (roof, boiler, parking lot, exteriors) have been made in the last 5 years, and what's planned in the next 2?
- Is there a deadline driving the sale (1031 exchange, divorce, estate, relocation)? That informs how much negotiation room exists.
- Schools are F-rated, which usually means shorter tenancies and higher turnover. Who's the typical renter profile here, and what's been the actual vacancy rate?
- What's the average days-on-market for RENTAL listings here right now (not sales)? A rising rental-DOM trend means longer vacancies and softer asking-rent achievability than the comps imply.
- What's the recent tenant-quality profile in this submarket — average credit score on applications, eviction rate, late-payment / NSF rate, and stable-employment percentage? A property-management company in the area should have these aggregated.
- How much new apartment / multifamily construction is in the pipeline within 1–3 miles? Heavy new supply (>2% of stock underway) typically softens rents 12–24 months out; light construction supports rent growth.
Investment metrics
- 1% rule
- 1.03% ✓
- Cap rate
- 7.30%
- Cash-on-cash
- 3.58%
- DSCR
- 1.16
- GRM
- 8.1
CMA / ARV
- ARV (on-the-fly)
- $361,380
- Comps found
- 2
Show comp detail 2 sales within ~0.75 mi
| Address | Dist | Beds/Ba | Sqft | Sold | Price | $/sf | Match |
|---|---|---|---|---|---|---|---|
| 243 Luzerne Rd | 0.00mi | 4/3.0 | 1,902 (0%) | 1mo | $315,000 | $166 | 99 |
| 13 Smoke Ridge Rd | 0.48mi | 4/3.0 | 2,052 (+8%) | 2mo | $390,000 | $190 | 63 |
Match score weights: distance 35% · size 25% · config 20% · recency 20%. Top-matched comps best support the ARV.
Projected returns pro-forma
-3.0% appreciation · 3.0% rent growth · sell at horizon
- IRR
- -10.6%
- Equity multiple
- 0.61×
- Total profit
- $-34,686
- Equity at exit
- $47,698
- IRR
- -1.3%
- Equity multiple
- 0.91×
- Total profit
- $-7,768
- Equity at exit
- $27,659
Cash invested: $89,572 (down + closing). Projections, not guarantees.
Landlord ↔ Tenant lean methodology
- Overall (STATE)
- 15 Strongly Tenant-Friendly
- State New York
- 15 Strongly Tenant-Friendly · D+10
- County
- — inherits STATE
- City
- — inherits STATE
ZIP-level market 12804
- Home prices YoY
- -9.0%
- Active inventory
- 162
- Price-to-rent
- 16.2×
Monthly cashflow live
- Estimated rent
- $3,294 medium interval (Pro) →
- Mortgage (P&I)
- −$1,678
- Tax from tax record
- −$524 /mo · $6,289/yr
- Insurance
- −$133
- HOA
- −$0
- Vacancy / Maint / Mgmt
- −$692
- Net cashflow
- $267
Break-even live
Sensitivity live
| Price | -10% $448 | -5% $358 | +0% $267 | +5% $177 | +10% $86 |
|---|---|---|---|---|---|
| Rent | -10% $7 | -5% $137 | +0% $267 | +5% $397 | +10% $528 |
| Rate | -1.0pp $428 | -0.5pp $349 | base $267 | +0.5pp $184 | +1.0pp $100 |
2-unit breakdown (identical units grouped — click to expand)
| Units | Beds | Baths | Est. rent |
|---|---|---|---|
| 2× units | 2 | 1.5 | $3,294 |
| #1 | 2 | 1.5 | $1,647 |
| #2 | 2 | 1.5 | $1,647 |
| Total (2 units) | $3,294 | ||
UW: 25.0% down · 7.5% · 30yr · 1.5% tax · 5.0% vac · 8.0% maint · 8.0% mgmt
Financing live
Cash to close
- Down payment
- $79,975
- Closing costs
- $9,597
- Reserves months
- —
- Total cash needed
- —
Loan-product check · same deal, 3 products live
Conventional
25% down · 7.5% · 30yr
- Down + closing
- —
- Monthly P&I
- —
- Monthly cashflow
- —
- DSCR
- —
- Eligible?
- —
Personal DTI + credit; lowest rate.
DSCR
20% down · 8.5% · 30yr
- Down + closing
- —
- Monthly P&I
- —
- Monthly cashflow
- —
- DSCR
- —
- Eligible?
- —
No personal income docs; deal must DSCR.
Hard money
10% down · 12.0% · 12mo
- Down + closing
- —
- Monthly P&I
- —
- Monthly cashflow
- —
- DSCR
- —
- Eligible?
- —
Short-term bridge; refi at stabilization.
Listing history 9 events
-
2026-03-10status Pending
-
2026-03-02$319,900 Active
-
2026-01-13historical Contingent
-
2026-01-13historical
-
2025-10-23$319,900 Active
-
2012-11-09soldstatus $157,500
-
2011-08-29soldstatus $20,000
-
2004-05-14soldstatus $20,000
-
1996-06-03soldstatus $29,900
ⓘ Source: listings_history table (triggers on properties + properties_extension) + one-shot
backfill from property_details.listing_events for pre-trigger history.
Tax reassessment forecast NY · Partial reset (capped growth)
- Current annual tax
- $6,289 · $524/mo
- Projected year-2 tax
- $6,289 · $524/mo
- Expected delta
- $0/yr ($0/mo · 0.0%)
ⓘ Screening estimate from a state-policy table — verify with the county assessor before closing.
Climate risk First Street
- Flood 1/10 Low FEMA zone X · 0% chance over 30 yrs
- Wildfire 4/10 Moderate
- Heat 3/10 Moderate 7 d/yr ≥96°F today · 16 d/yr by 30 yrs out
- Wind 2/10 Low 3% chance of damaging wind over 30 yrs
- Air quality 1/10 Low 0 unhealthy d/yr today · 0 by 30 yrs out
Nearby sold comps map
Loading sold comps map…
Walkable amenities ~0.75 mi
Loading nearby amenities…
Taxation est. · year 1
- Rental income
- $39,528
- − Mortgage interest
- −$17,919
- − Property taxes
- −$6,289
- − Insurance
- −$1,600
- − Repairs & maintenance
- −$3,162
- − Management
- −$3,162
- − Depreciation
- −$9,306
- Taxable loss
- −$1,910
- Est. tax savings @ 24.0%
- +$458
- After-tax cash flow
- $3,666/yr
For passive investors: Depreciation is non-cash, so a rental often shows a tax loss while cash-flowing — sheltering income. Rental losses are passive: they offset passive income freely, and up to $25,000/yr can offset ordinary (W-2) income if you actively participate and your MAGI is under $100k (phasing out to $0 by $150k); unused losses carry forward. On sale, claimed depreciation is recaptured at up to 25%, and gains may owe capital-gains tax (a 1031 exchange can defer both). Figures are a year-1 estimate at your 24.0% rate — not tax advice; consult a CPA.
Schools (NCES district)
- District
- Queensbury Union Free School District
- NCES district ID
- 3624030
- Math proficiency
- 57% ▼ -6.00%
- Reading proficiency
- 62% ▲ 2.00%
- Median HH income
- $61,595
- Composite
- 51.76/100
- National rank
- #1679
- State rank
- #230 of 590 in NY
Livability — West Glens Falls
- Score
- 71/100
- State rank
- #388
- US rank
- #6663
Category grades
Schools grade is shown separately in the Schools card above.
Census & demographics
- Census place
- West Glens Falls, NY
- Population (ZIP)
- 28,175
Population outlook (Warren County) Hauer SSP2
- Today (2025)
- 62,372 people
- By 2030
- 60,491 · -3.0%
- By 2040
- 55,616 · -10.8%
- By 2050
- 50,437 · -19.1%
- By 2075
- 40,843 · -34.5%
- By 2100
- 31,159 · -50.0%
Race, ethnicity, and origin ACS 2023
- Neighborhood character
- Predominantly White (92%)
- Race & ethnicity
- White 92% Two or more races 4% Hispanic / Latino 3%
- Common ancestry
- Lithuanian 8% Romanian 6% Slovak 4%
- Foreign-born
- 4% · Canada
- Languages at home
- 96% English-only · Spanish 2% French/Haitian/Cajun 1% German/W. Germanic 1%
Political lean MEDSL · Warren
- 2024 margin
- Toss-up / Even · D 47.9% · R 52.1%
- 2008→2024 swing
- -6.9pp toward R · 2008: 2.6pp · 2024: -4.2pp
- All cycles
- 2024: R+4.2 2020: R+0.2 2016: R+10.6 2012: D+2.1 2008: D+2.6
Not yet ingested
- Civics
- —
Market trends
- HPI YoY
- ▼ -33.40%
- Current HPI
- 337.1909
- Rent YoY
- —
- Metro
- —
- State GDP YoY
- ▲ 2.60%
- F500 in state
- 92
Industry mix (Fortune 500 HQ in NY)
| Industry | F500 HQs | Revenue |
|---|---|---|
| Financial Services | 10 | $950B |
|
||
| Consumer Goods | 9 | $162B |
|
||
| Insurance | 4 | $225B |
|
||
| Telecommunications | 2 | $144B |
|
||
| Pharmaceuticals | 2 | $112B |
|
||
| Media / Entertainment | 2 | $69B |
|
||
Price history
+969.9% since first listed9 events — show timeline
- 2026-03-10 Pending — Global MLS
- 2026-03-02 Listed $319,900 Global MLS
- 2026-01-13 Contingent — Global MLS
- 2026-01-13 Listing Removed — Global MLS
- 2025-10-23 Listed $319,900 Global MLS
- 2012-11-09 Sold (Public Records) $157,500 Public Records
- 2011-08-29 Sold (Public Records) $20,000 Public Records
- 2004-05-14 Sold (Public Records) $20,000 Public Records
- 1996-06-03 Sold (Public Records) $29,900 Public Records
Property tax history
+5.1%/yrLatest (2025): $6,289 · +3.5% YoY. Source: county tax records.
Cash-flow waterfall
monthlySold comps — $/sqft
last 12 mo · ≤1 miLoading sold comps…