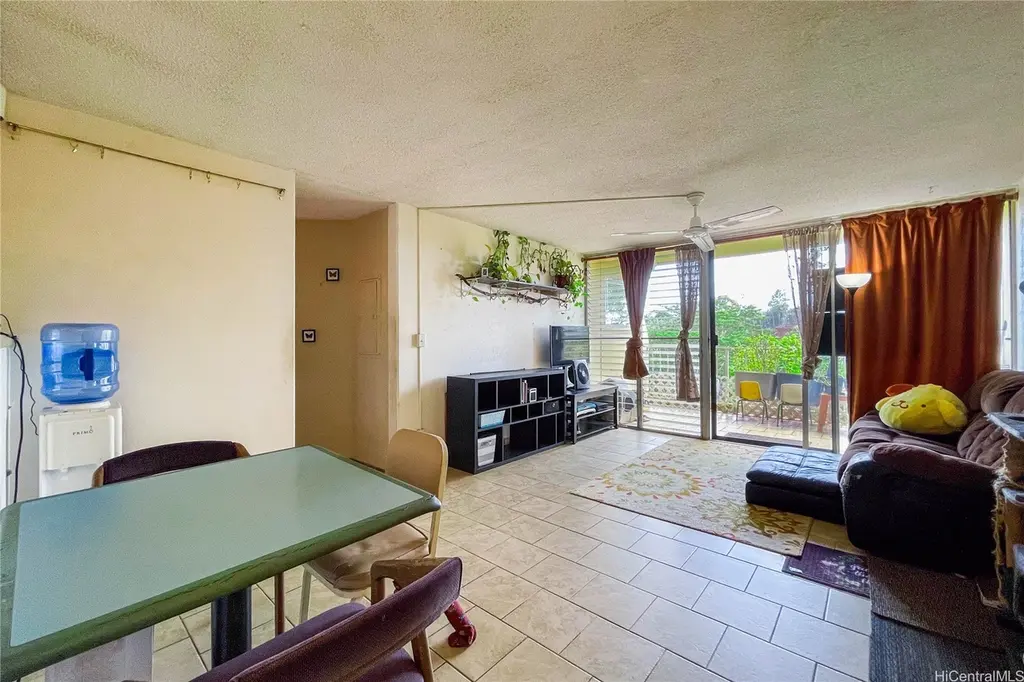
95-2052 Waikalani Pl Unit B404
Waipio Acres, HI 96789
$355,000D
2 bd · 1.0 ba ·
799 sqft ·
Built 1973
· Condo
· Active
· 31 DOM
Cashflow @ list (25.0% down · 7.5%)
Estimated rent
$2,500/mo
Mortgage (P&I)
−$1,862
Tax + insurance
−$250
HOA
−$479
Vac / Maint / Mgmt
−$525
Net cashflow
$-616/mo
Annual
$-7,393/yr
Cap rate
4.21%
Cash-on-cash
-7.44%
DSCR
0.67
1% rule
0.70%
Cash to close
$99,400
Investor read
- This is a 2-bed/1.0-bath condo listed at $355k.
- At list price, monthly cash flow is $-616 ($-7k/yr) — negative.
- To cash-flow at today's rent, offer at most $246k (30.7% below list).
- To meet the 1% rule (rent ≥ 1% of price), the offer needs to be $250k (29.6% below list).
- It's been on market 31 days — a 3% lower offer ($344k) is reasonable based on typical stale-listing flexibility.
- Recommended offer: $246k (30.7% below list) — sets the bar for cash-flow.
- In year one you build about $8k of equity ($2k loan paydown + $5k appreciation (1.5% local appreciation)).
- Location reads 74/100 on livability (#14 in HI, #4,795 nationally) — a middle-class / working-renter tenant base. Strengths: commute A+, employment A+, health & safety A+; Watch: amenities F, cost of living F.
- Hawaii Department Of Education (suburban): math 32% / reading 50% proficiency, ranked #1 of 1 in HI (top 100%) — families likely to look elsewhere, expect single-tenant / working-renter base with shorter leases.
- Zoned schools: Kipapa Elementary School (math 39% / reading 52%, grade D-, #70 of 183 statewide, top 39%, 518 students, 47% FRL); Mililani Middle School (math 40% / reading 67%, grade C+, #4 of 42 statewide, top 7%, 1,580 students, 20% FRL); Mililani High School (math 42% / reading 73%, grade C, #2 of 43 statewide, top 2%, 2,565 students, 18% FRL).
- Market conditions: Rents rising fast (+5.5%/yr); 134 active listings in the ZIP; 22 comparable units currently listed for rent nearby; rentals at typical pace (median 19d on market — plan ~3-4 weeks tenant-placement turnaround); high-income renter base; 1,638 units permitted in Honolulu County in 2024 (793 in 5+ unit buildings).
- Honolulu County population projected at +17% by 2050 — long-run rental-demand tailwind backs the buy-and-hold thesis.
- 7 sale attempts since 20y ago with the ask held roughly flat each time — persistent listings suggest the price (not the market) is what's stuck; bring a comps-based counter.
- Current owner paid $230k; list at $355k implies a 54% gain — meaningful room to come down on a strong offer.
- By year 5, paydown + projected appreciation supports a ~$35k cash-out refi (75% LTV) — recoverable capital for the next deal without selling this one.
Questions for listing agent
- What do current leases actually rent for vs. the listed asking? Can we see a recent rent roll and the last 12 months of T-12 income?
- It's been on market 31 days. Have you received any prior offers? Is the seller open to a 31% concession, seller financing, or rate buy-down credit?
- Built in 1973 — when were the roof, HVAC, electrical panel, plumbing, and water heater last replaced?
- What does the HOA fee cover, when was the last increase, and are there any pending special assessments or reserve-fund shortfalls?
- Any open or pending special assessments — roof, HVAC, plumbing, elevator, façade? What's the per-unit balance and payoff schedule, and is the seller paying it off at close or rolling it to the buyer?
- Is there a deadline driving the sale (1031 exchange, divorce, estate, relocation)? That informs how much negotiation room exists.
- The area grade is low — what's the realistic commute time and amenity access for the typical tenant pool here? Any planned neighborhood developments (good or bad) we should know about?
- What's the average days-on-market for RENTAL listings here right now (not sales)? A rising rental-DOM trend means longer vacancies and softer asking-rent achievability than the comps imply.
CashFlowRE · CFR-J4V2S9CD46R0CP
· Data 1 day ago
cashflowre.app · 2026-05-29